Argos
This chapter is a short introduction in using nJAMS Argos. nJAMS Argos is designed to monitor infrastructure and applications by collecting and presenting a wide range of metrics. nJAMS Argos is part of your nJAMS Cloud instance. It receives metrics from an nJAMS Agent. The nJAMS Agent in turn is the central collection point of metrics that come from various sources. Please refer to nJAMS Agent documentation to learn how to setup and start an nJAMS Agent to provide your nJAMS Cloud instance with metrics.
In the following you will learn how to visualize the incoming metrics in custom dashboards.
Argos dashboard
Let’s start from scratch with a blank dashboard. The following steps demonstrate a procedure for a simple scenario. We want to create a new dashboard containing a page with a simple component that should indicate an alert, if a TIBCO BusinessWorks 6 AppNode is unavailable.
| 1. Create a new dashboard: | |
|---|---|
Go to nJAMS GUI and select tab 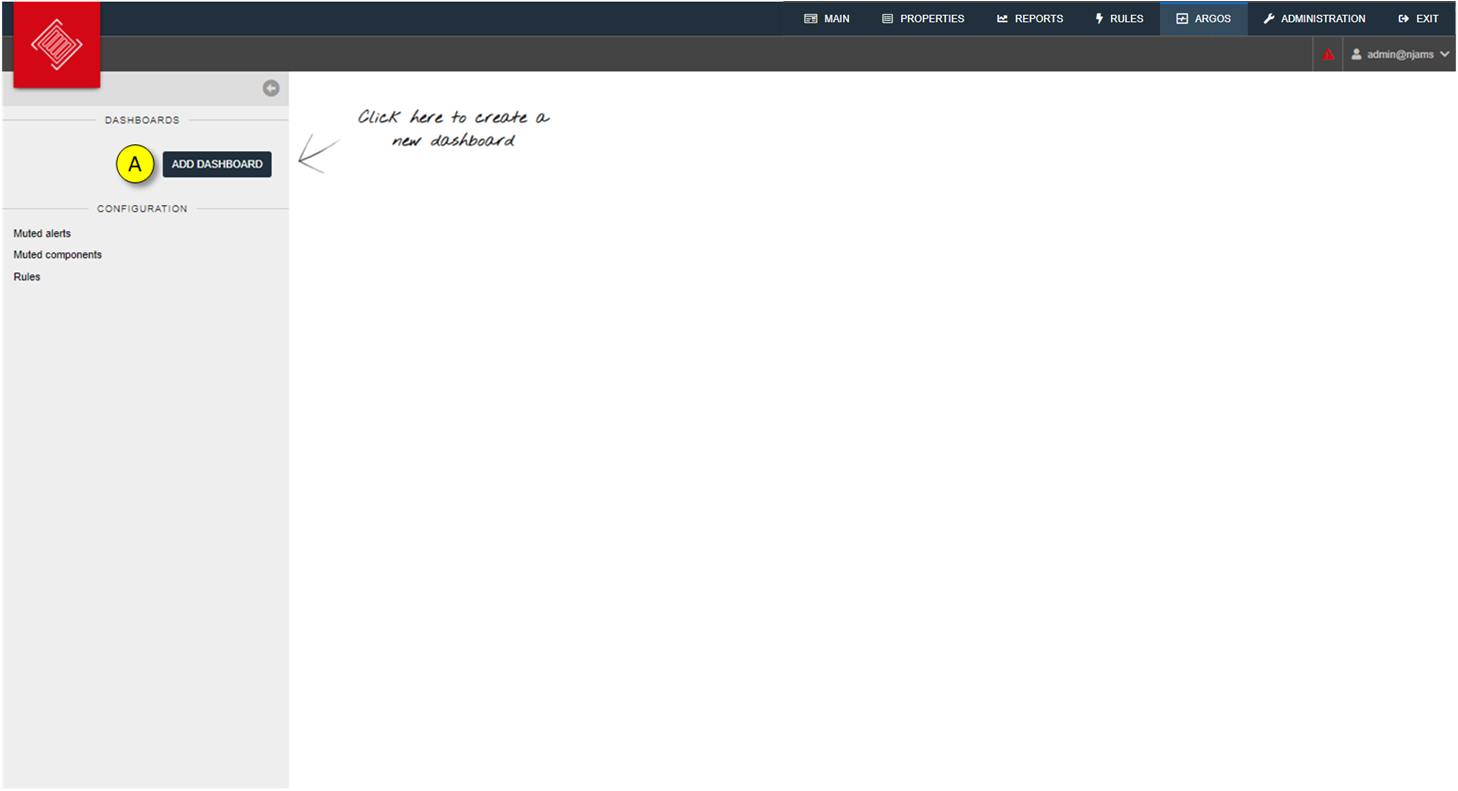
|
|
| 2. Add page: | Add a page to the dashboard. A dashboard can consist of multiple pages. 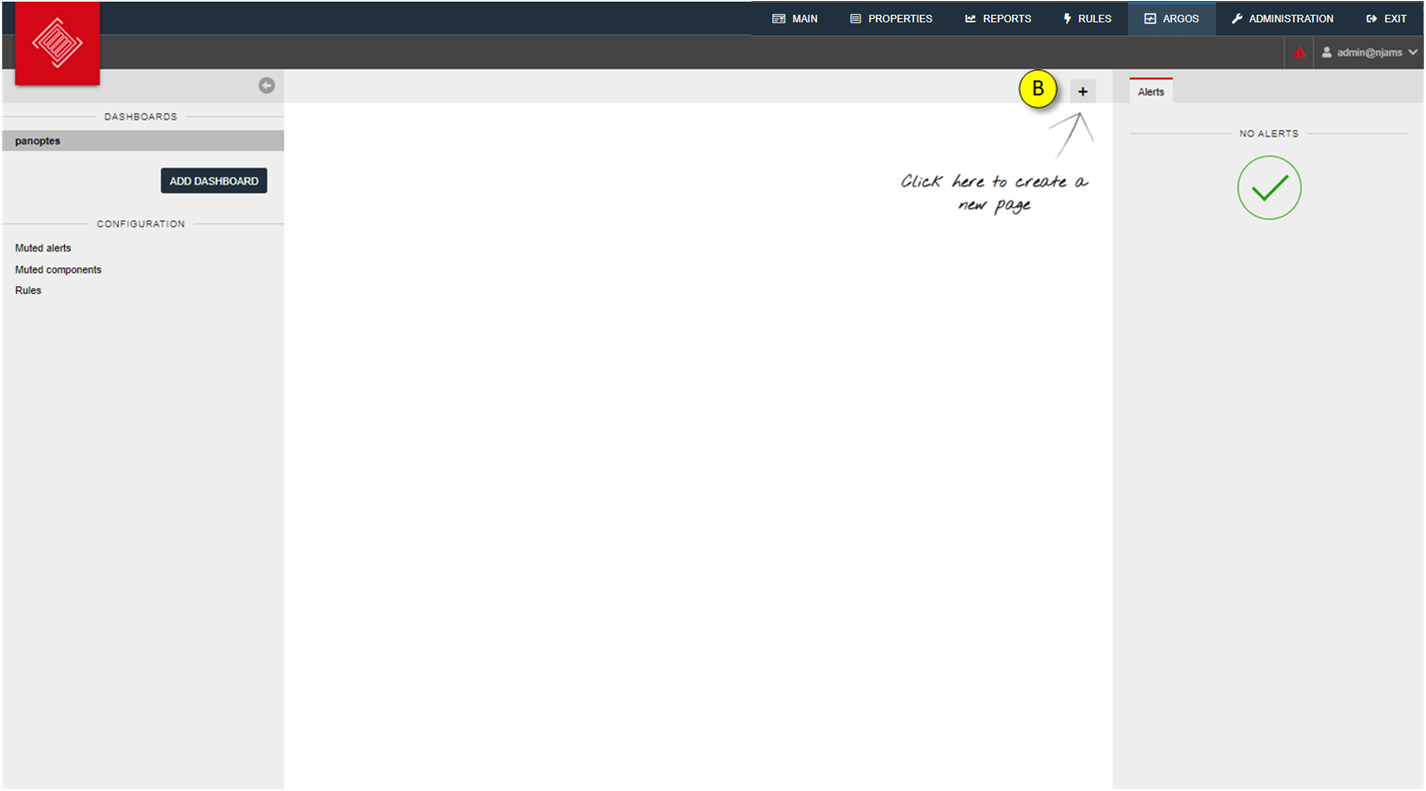
|
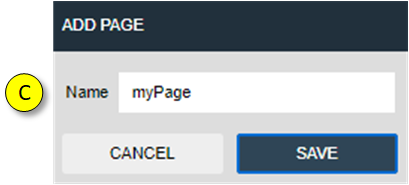
| 3. Enter a name for the page: | |
|
|
| 4. Switch to Edit mode: | |
Enter the Edit mode in order to modify the content of this page. 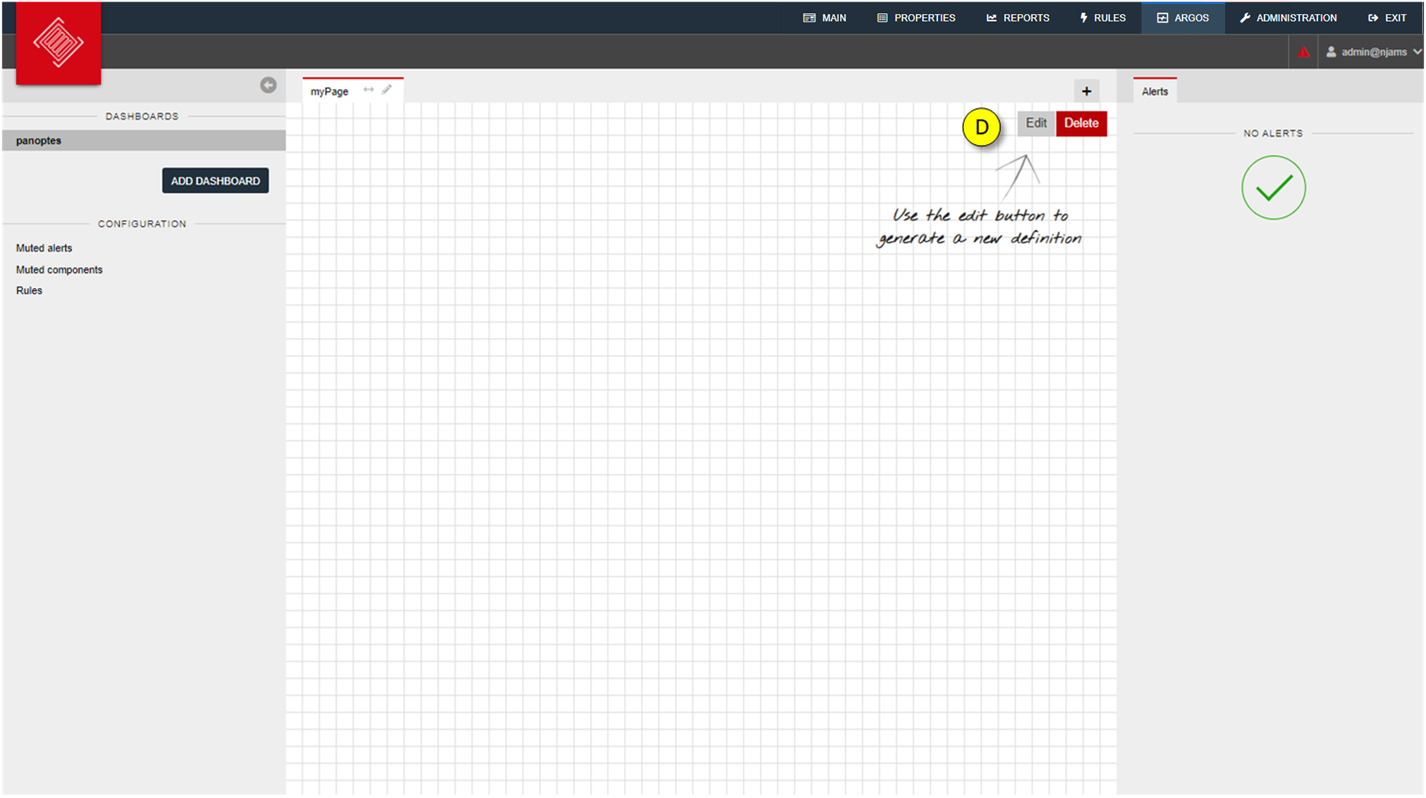
|
|
| 5. Add a component to the page: | |
A component represents an entity that should be under observation. For example, a component could be an application, a machine, an RDBMS, etc. A component can have a single rule or a set of rules that can indicate the status of the component or trigger alerts. 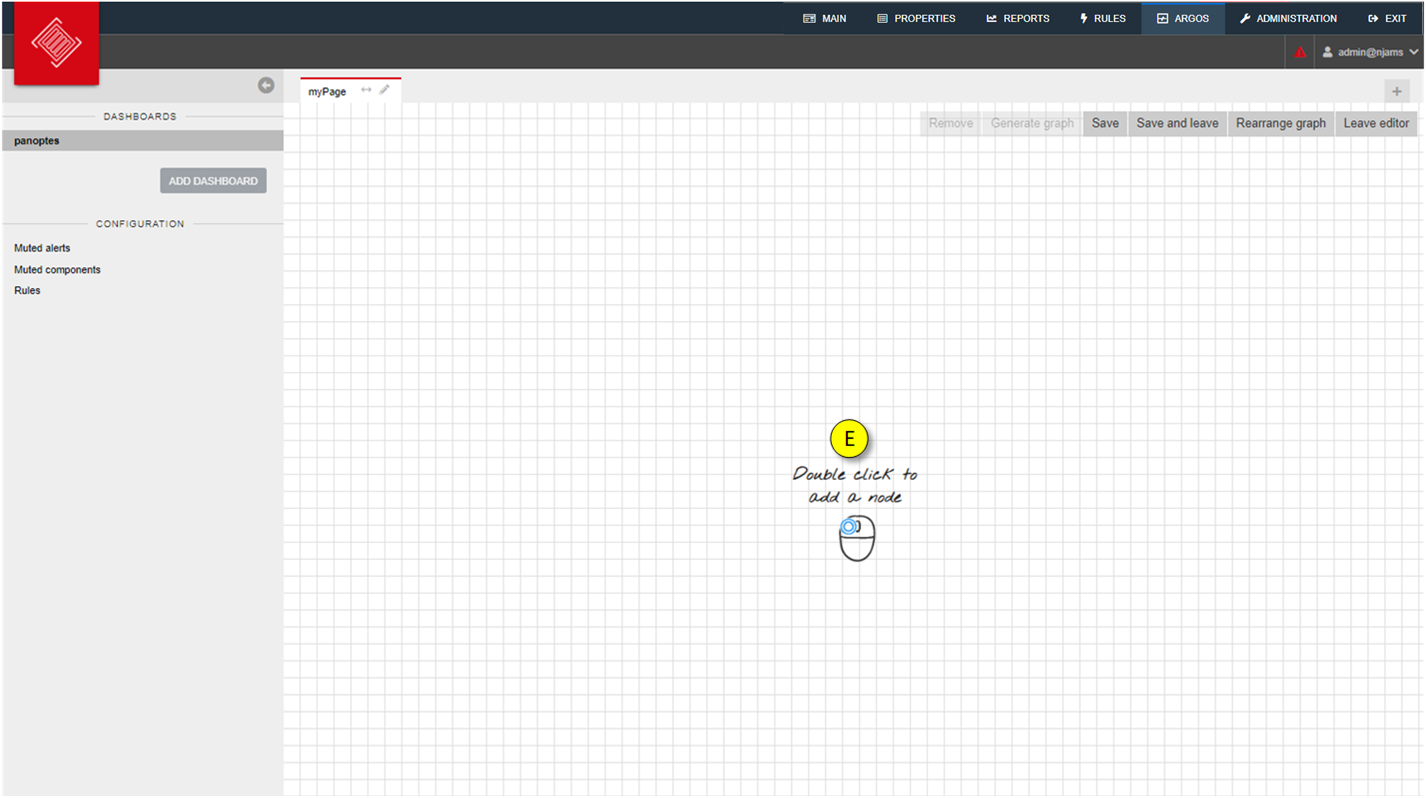
|
|
| 6. Configure the component: | |
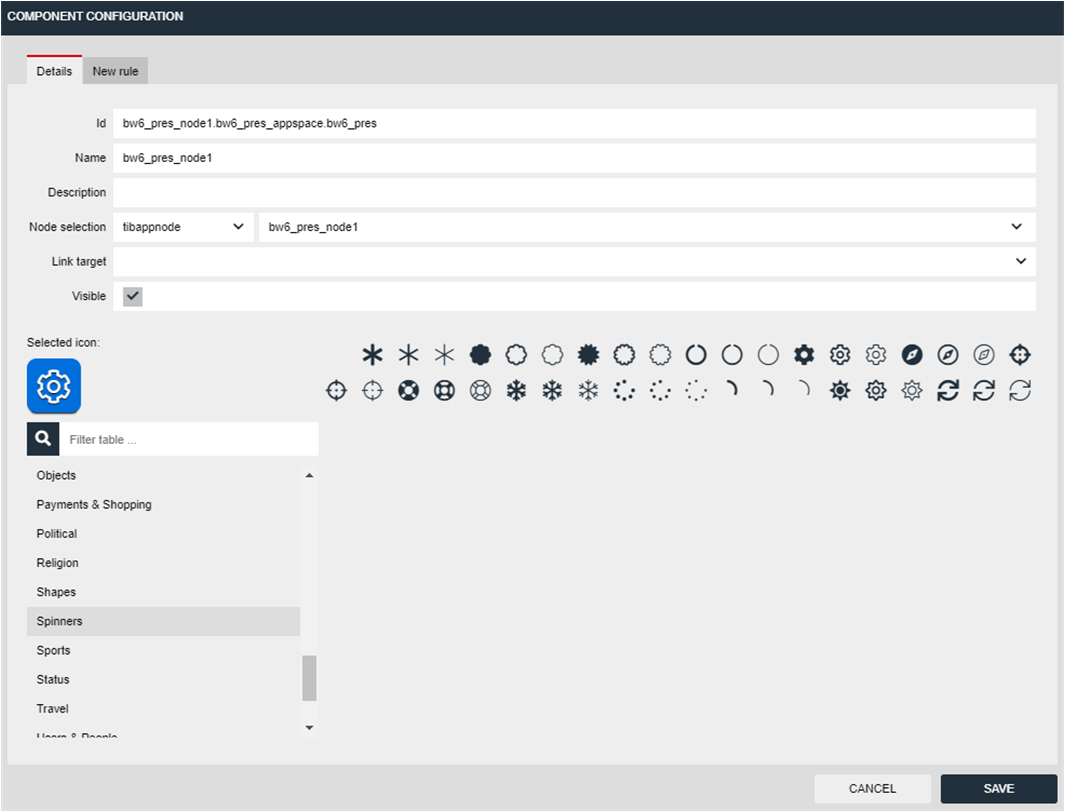
A component can be configured in the following dialog: 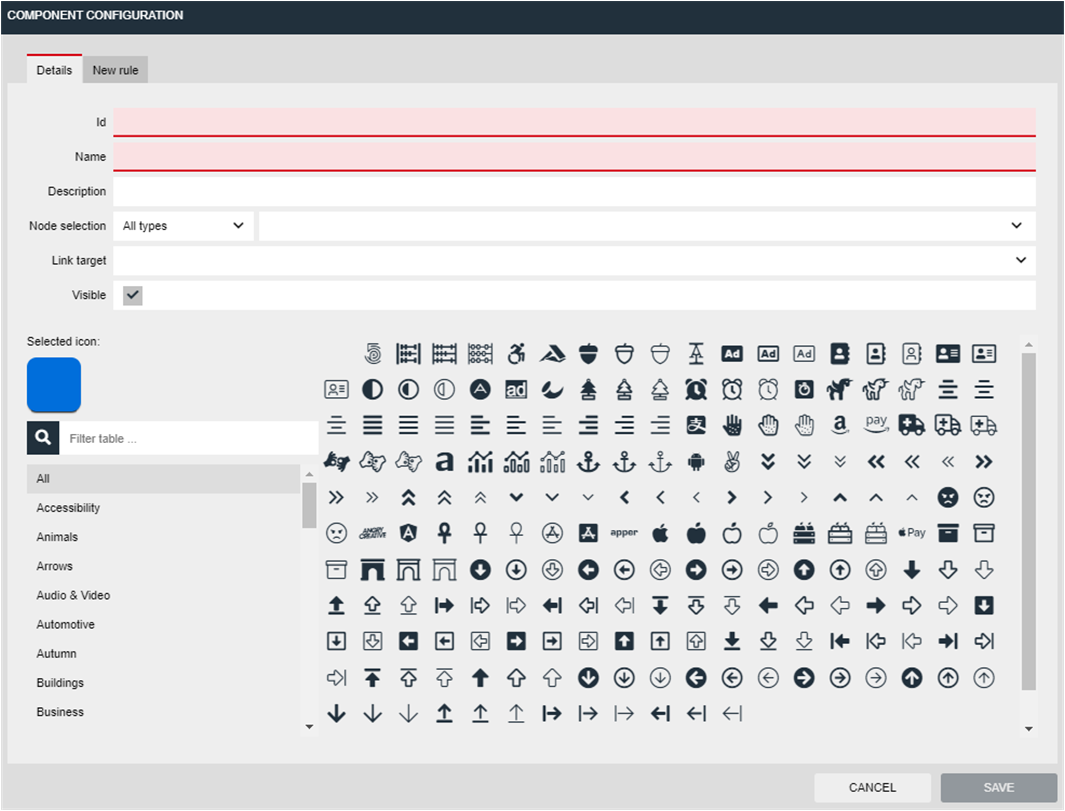
Id: Unique identifier of the component. Will be generated automatically, when a node is selected from list of nodes below. Name: Name of the component. Description: Take your notes here for the component. Node selection: Select a category of available nodes. The list next to it contains available nodes of the selected category. Link target: Add a link to a different dashboard to easily navigate from a component to a different dashboard/page. Visible: A component is visible by default, but can be hidden, if required. |
|
| 7. Select available categories of nodes: | |
In our scenario we want to observe a TIBCO BusinessWorks 6 AppNode, so we select category 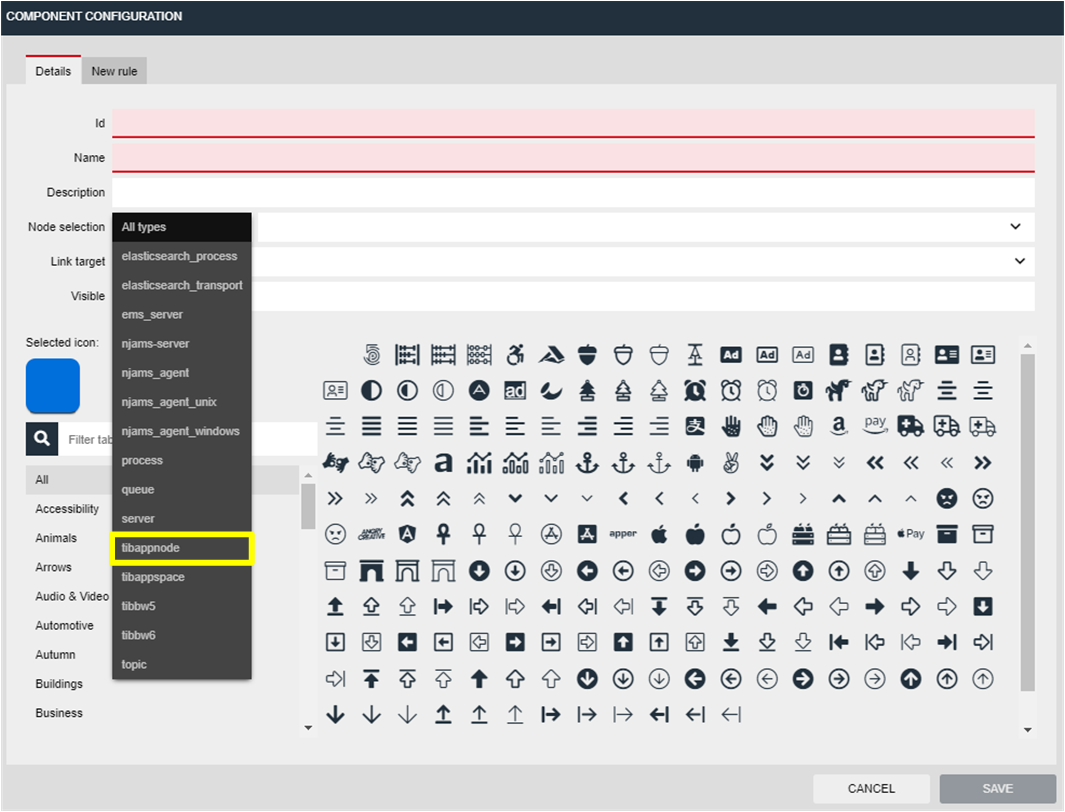
|
|
| 8. Select available nodes of a category: | |
The list provides available nodes in the envionment: 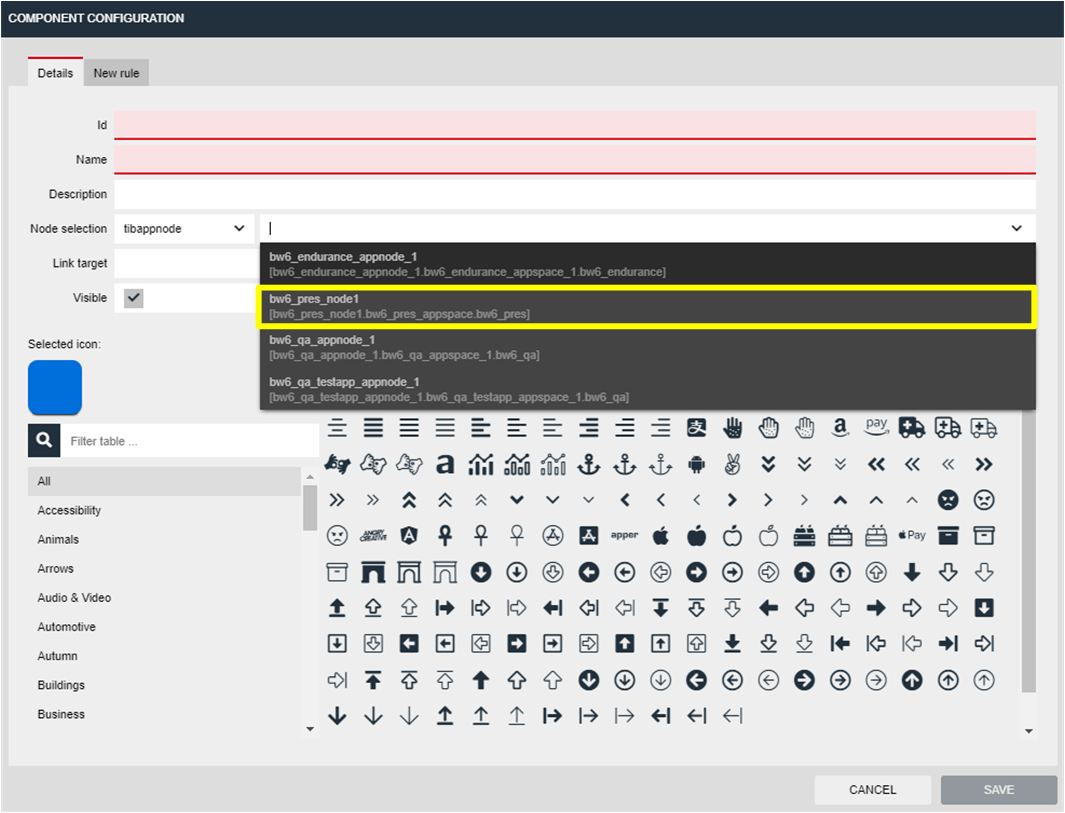
|
|
| 9. Because it’s such a joy, you can add a suitable icon for the component: | |
|
|
| 10. Add a rule to the component: | |
In our scenario we want to get notified, when the AppNode is not responding, respectively unavailable. 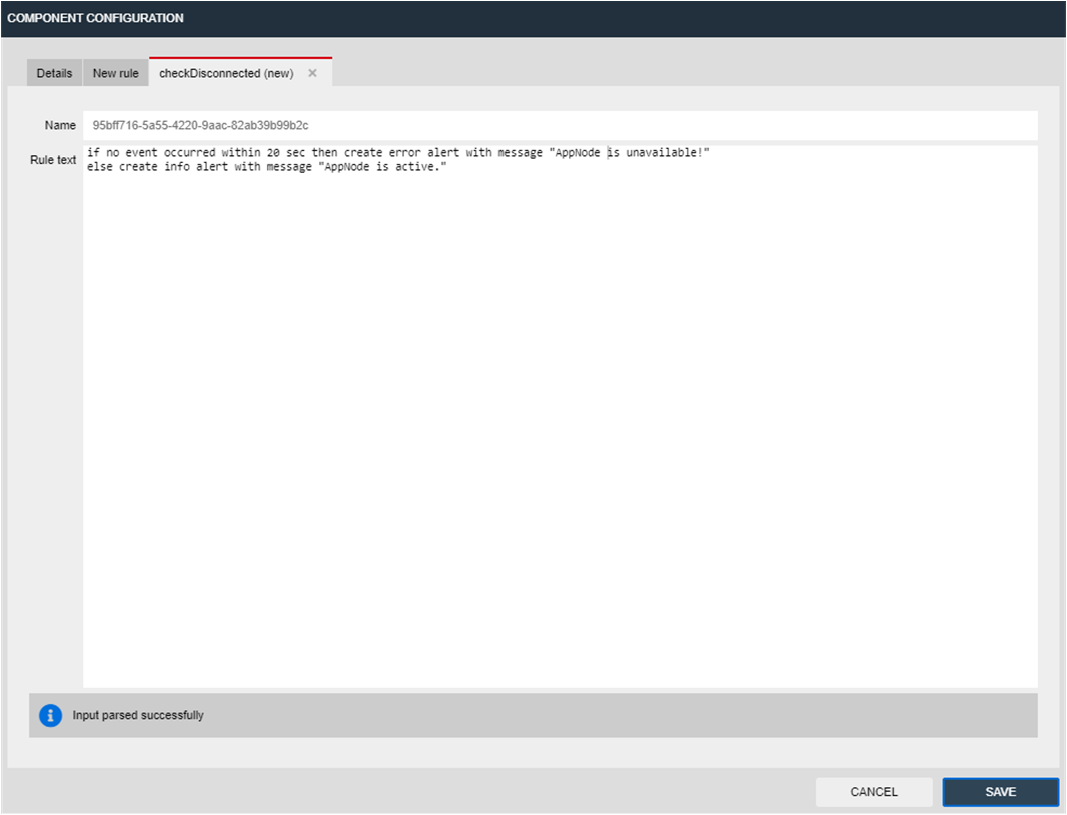
The specified rule checks for an event of the AppNode every 20 seconds: if no event occurred within 20 sec then create error alert with message "AppNode is unavailable!"
else create info alert with message "AppNode is active."
If there is no event from the AppNode within 20 seconds, it is assumed the AppNode is inactive, respectively unavailable. In that case, an alert of type ‘Error’ is generated. Otherwise the AppNode is supposed to be active. |
|
| 11. Save configuration of component: | |
Click on |
|
| 12. Save page: | Click on 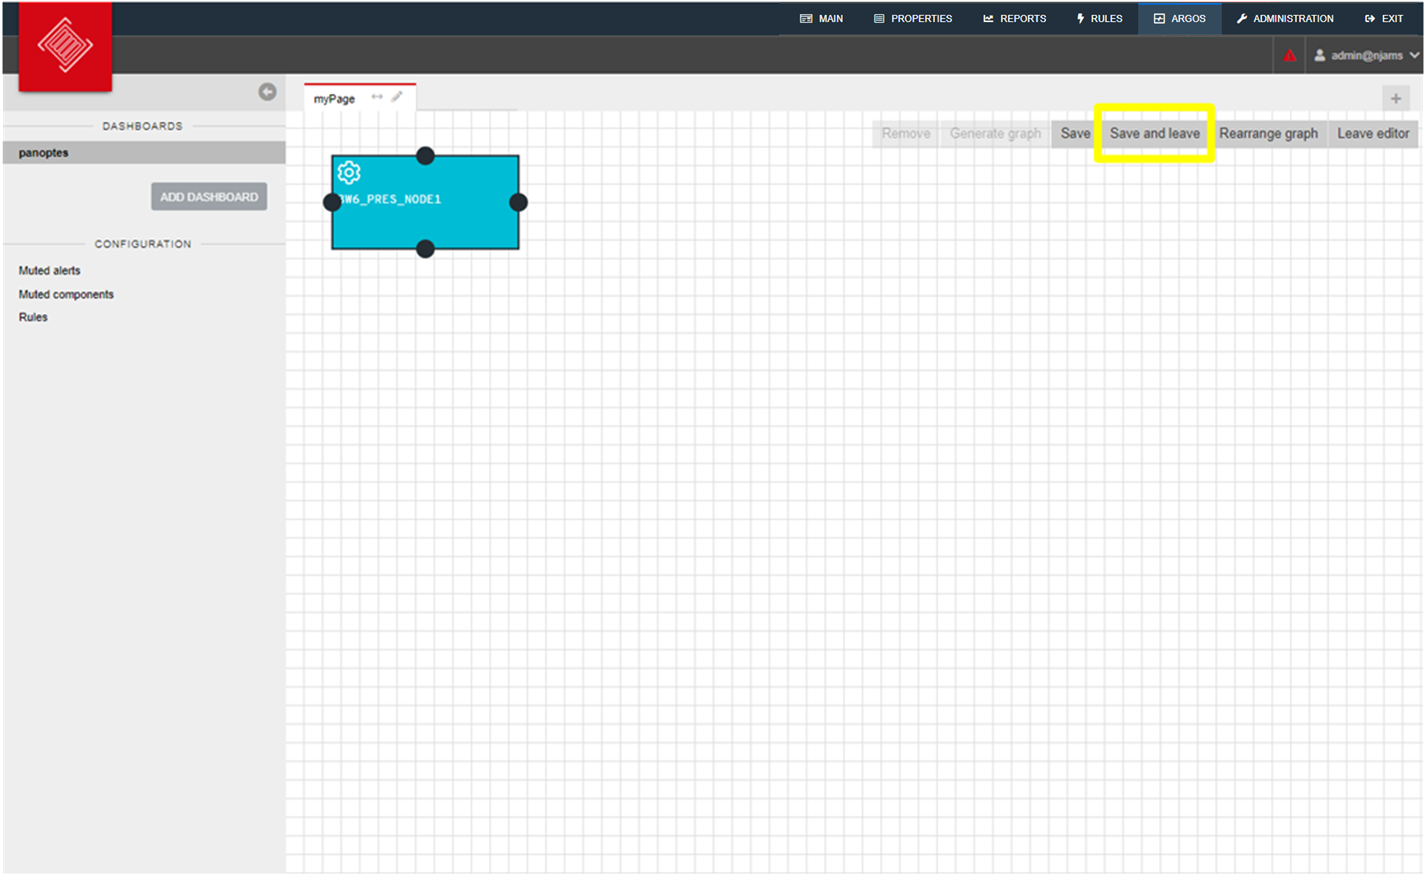
|
| 13. View result on dashboard: | |
Once you left Edit mode, the dashboard becomes active and displays the component(s) and its states: 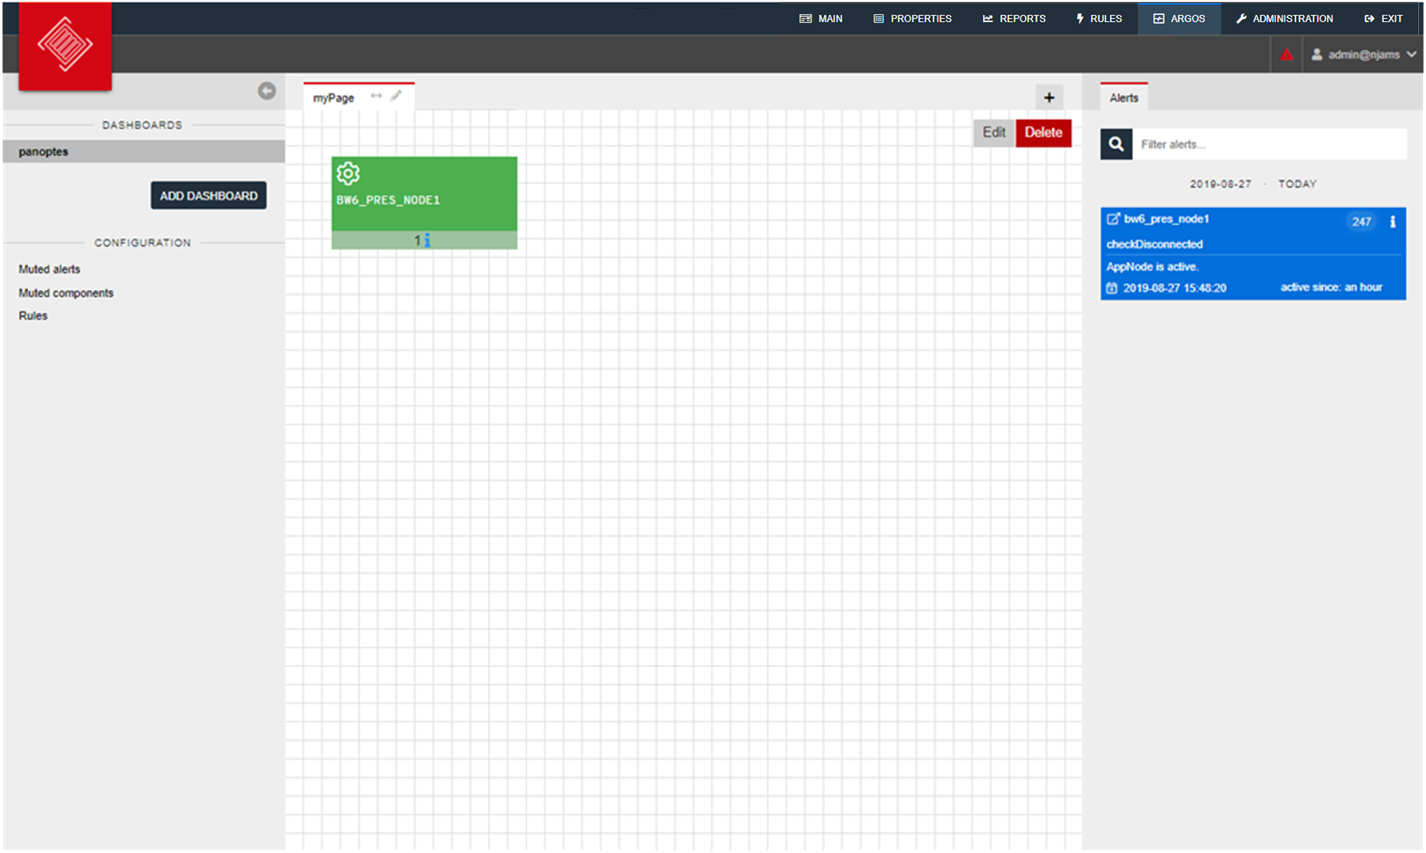
You can see the state of the AppNode is active, the tile in column ‘Alerts’ is colored blue, which indicates an alert of type ‘Info’. As soon as the AppNode is stopped, the tile will become red, which indicates the state of the AppNode is inactive: 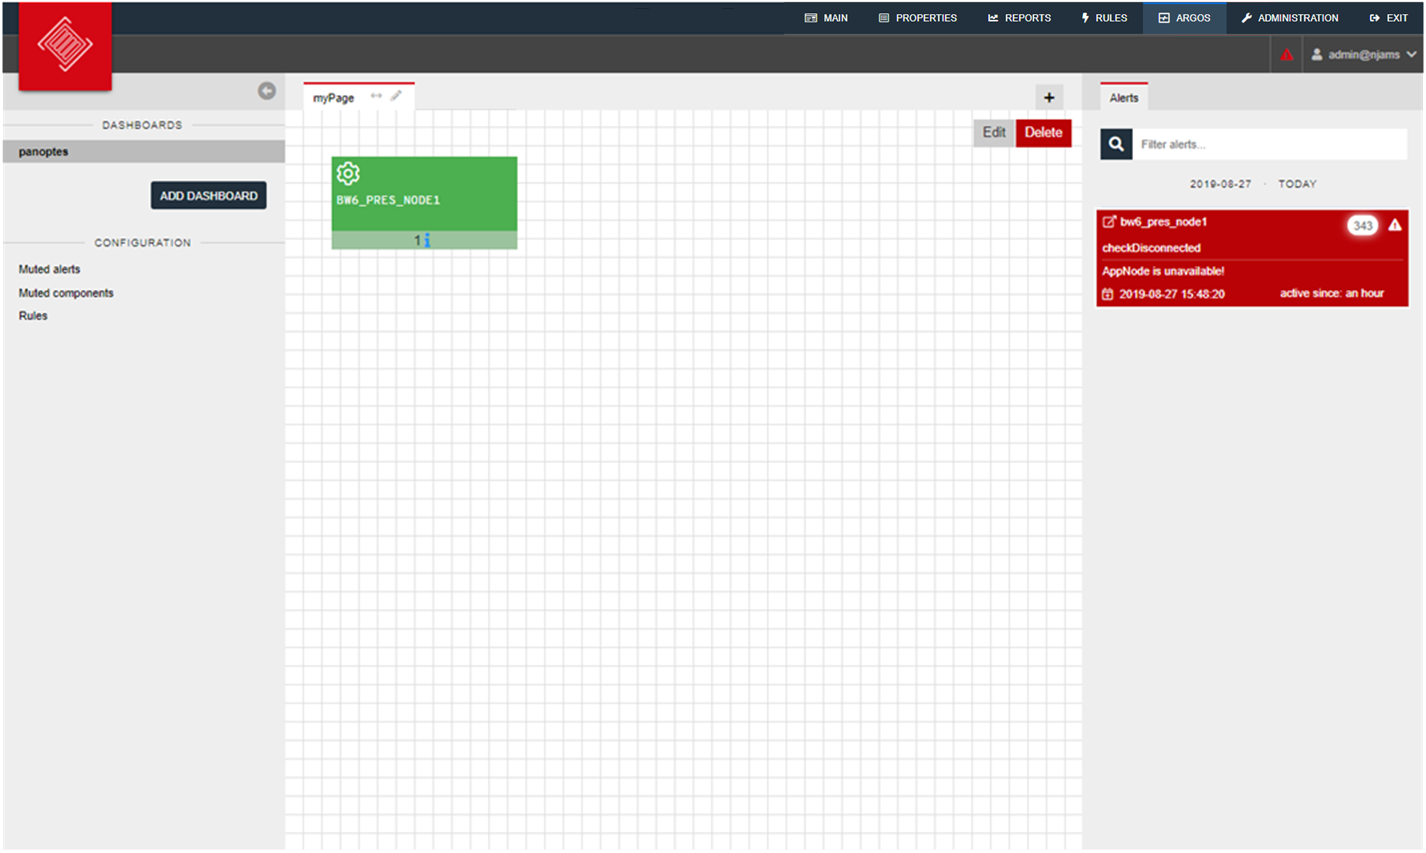
When the AppNode is responding again, Argos will recognize the availability of the AppNode and clear the error alert. |
|
| 14. Add an additional component: | |
Assume you have another AppNode that should be monitored for availability as well. Add an additional component to the page based on the same rule: 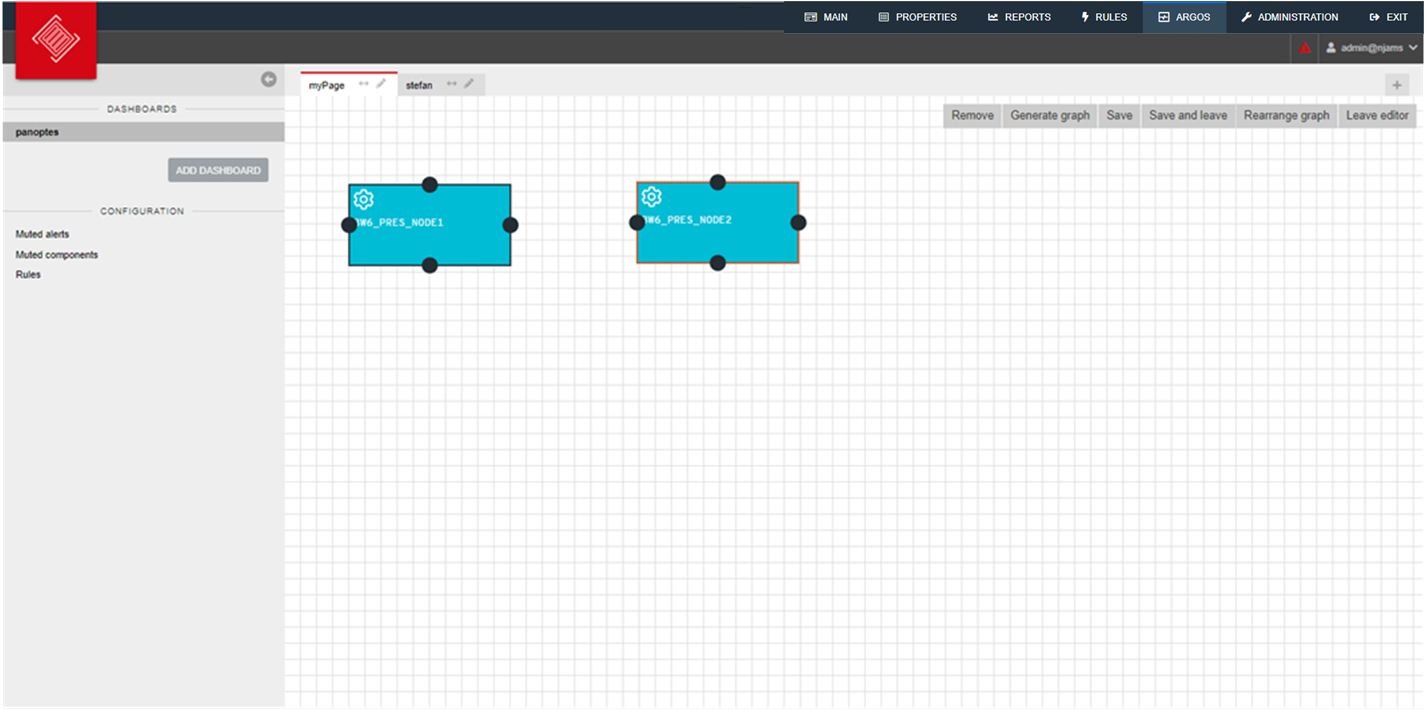
|
|
| 15. Add parent component: | |
In TIBCO BusinessWorks 6 AppNodes are subordinated to an AppSpace. Although an AppSpace is just an organizational unit in TIBCO BusinessWorks 6, we may want to monitor the AppSpace as well. So, the next task is to create a third component for the AppSpace as a parent component to both AppNodes. Argos allows to define relationships between components. In our scenario we want to propagate alerts on AppNode level to AppSpace level. In case an alert occurs on any AppNode, we want to indicate the alert on the AppSpace component. Add a third component for the AppSpace and link this component to both AppNode components: 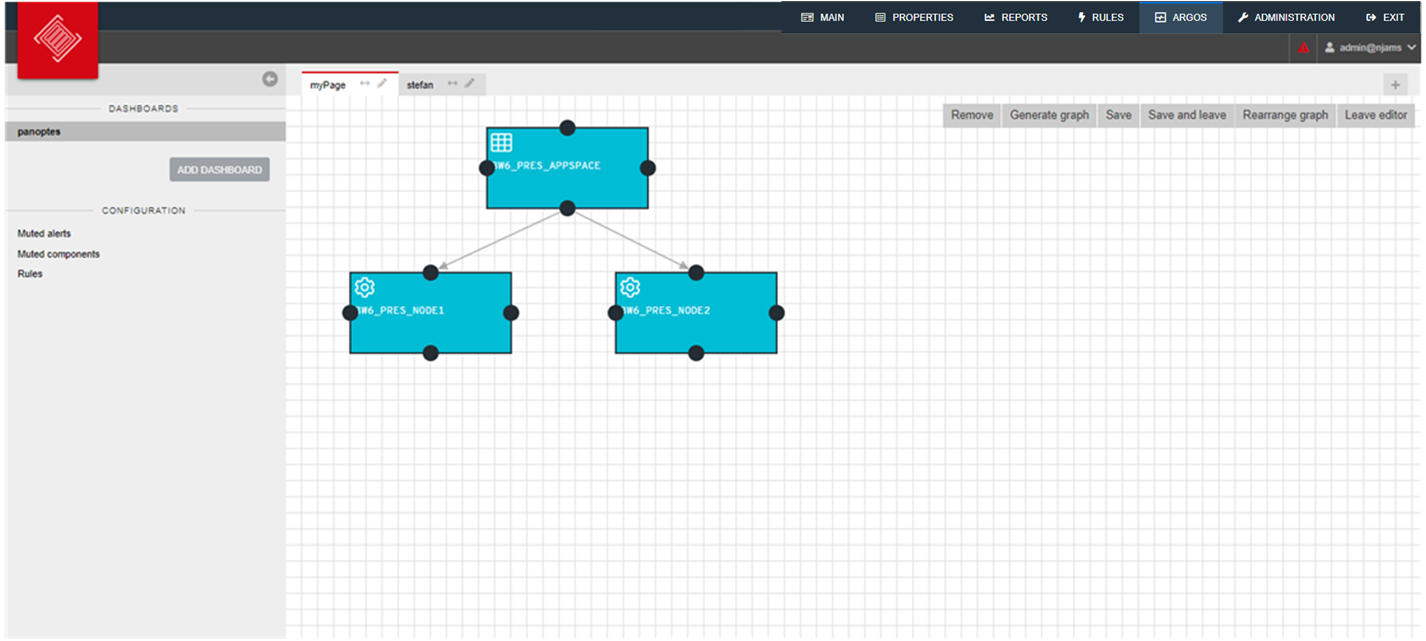
|
|
| 16. Save and leave Edit mode and view the result on the dashboard: | |
There are now three components under observation of Argos. The top level component represents the AppSpace with two subordinated components for the AppNodes. Both AppNode components are represented by a separate tile on the alert section to the right: 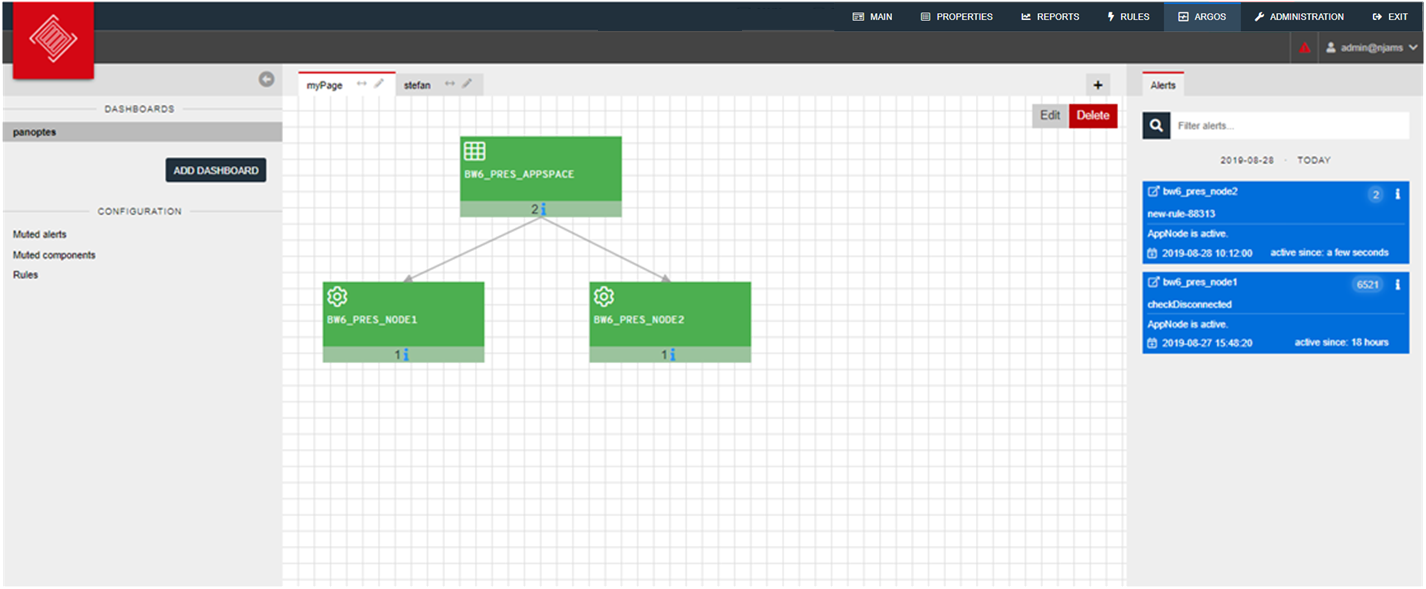
See what happens, when AppNode 2 is unavailable: 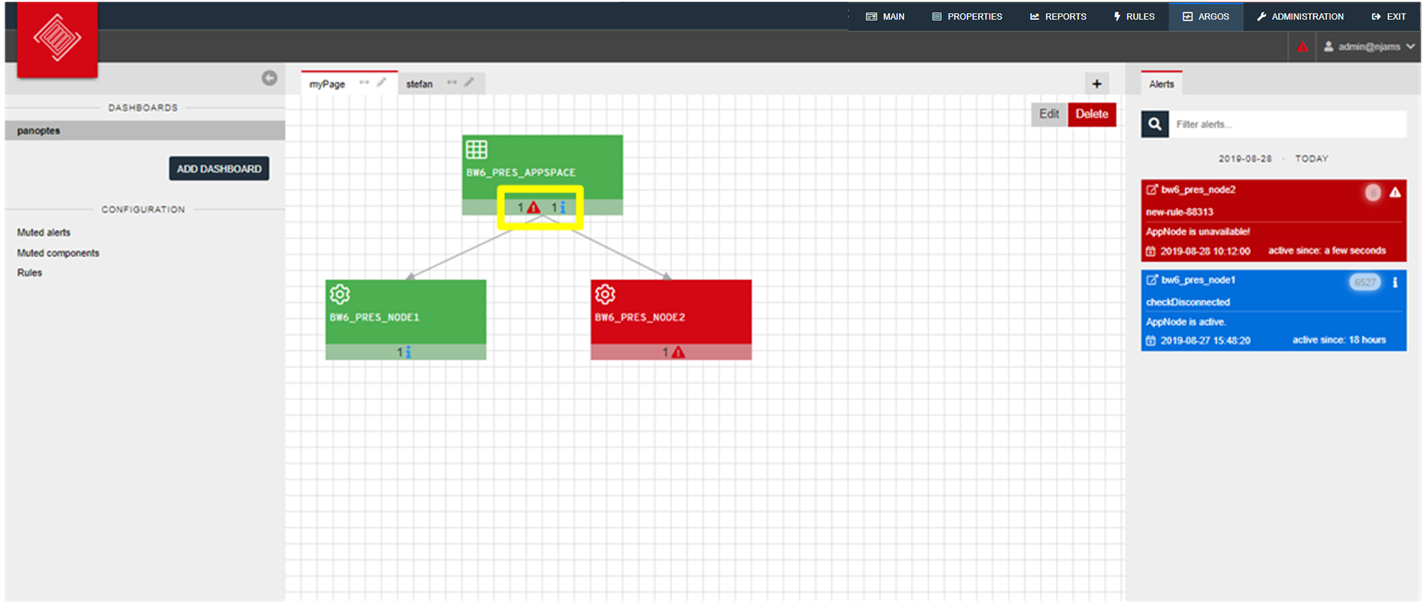
As expected, an alert is displayed on the tile for AppNode 2. On the parent component, the AppSpace, you can see an alert icon that indicates a disfunction of the AppSpace itself, respectively of the linked AppNode components. The alert of AppNode 2 has been propagated to the AppSpace. In case of an alert, you may want to see more information of the disturbed component. Click on a compontent to get more details: 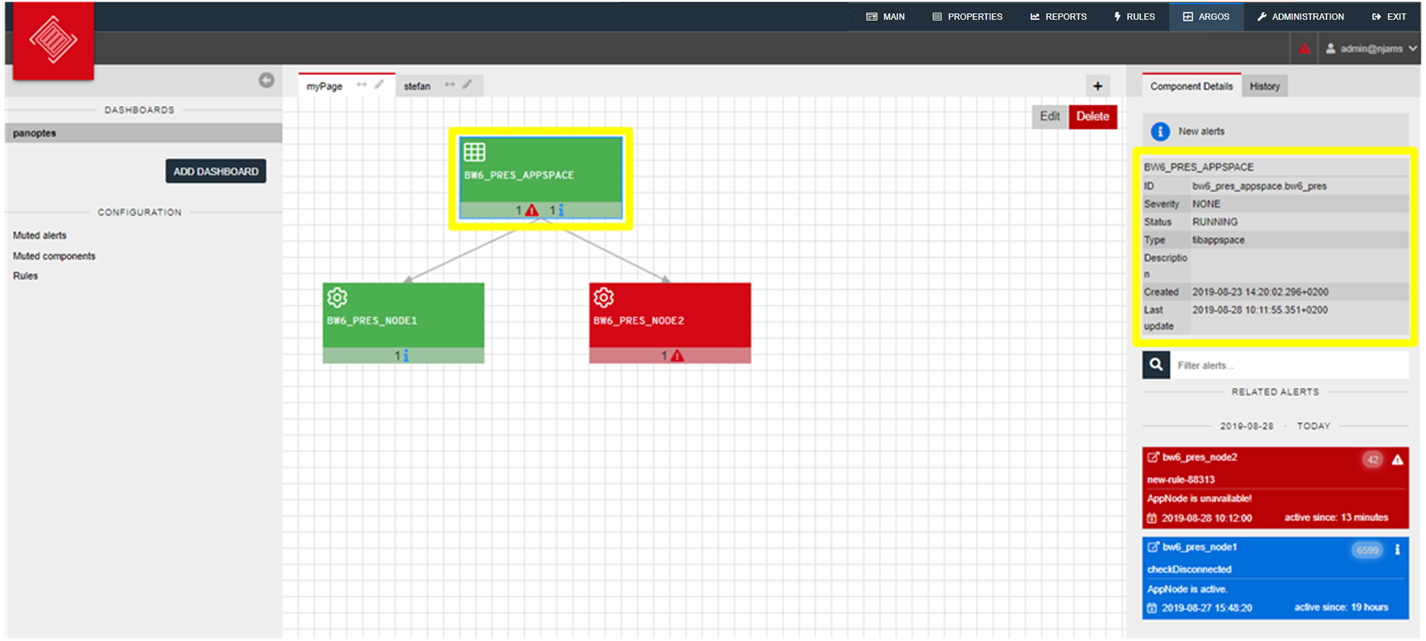
|
|
Based on this short introduction you should now be able to start creating your own dashboards with Argos.
Working with Argos
Composite
Use a composite to combine several components to one aggregated element. For example, you already have a dashboard that contains components of nodes of an Elasticsearch cluster. Each component represents the state of an Elasticsearch node:
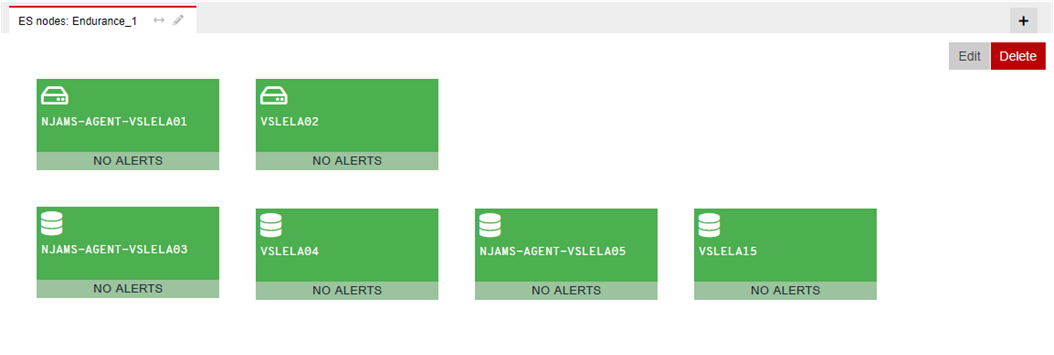
For just getting a short overview of the entire cluster without interest in the particular nodes, you may want to have a composite that represents the combined state of all nodes, respectively the state of the entire Elasticsearch cluster.
Procede as follow:
Add a new page “Overview” and save it.
Edit the page and add a new component:
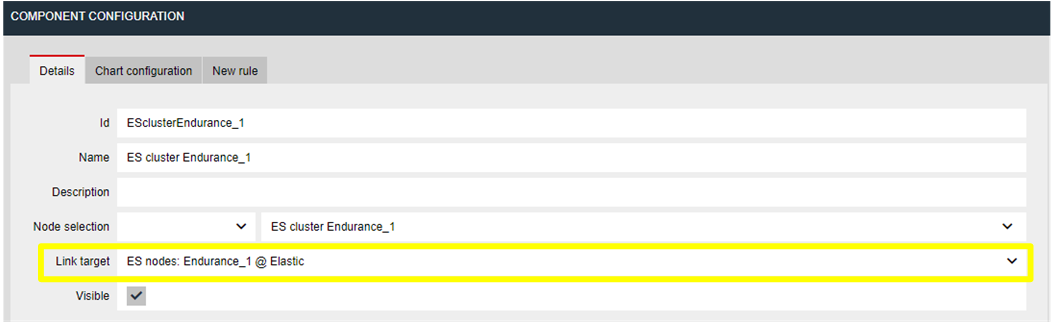
- Enter a unique id and a name
- At Link target select the page of the Elasticsearch cluster from the list
- Save component configuration
Save page and leave editor
You now have a new page containing a composite that represents the entire cluster state:
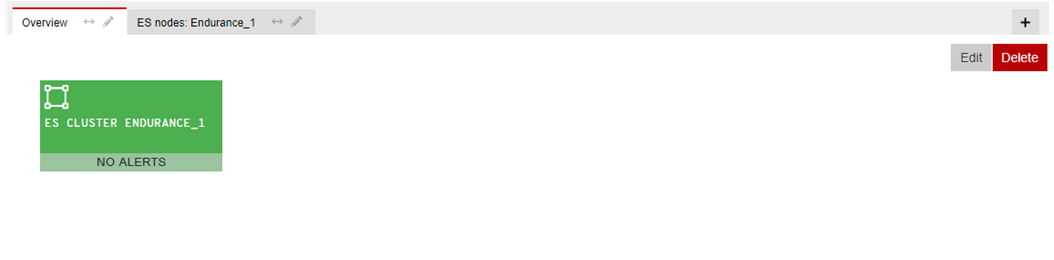
When you hover over the composite element, you can click on several icons:
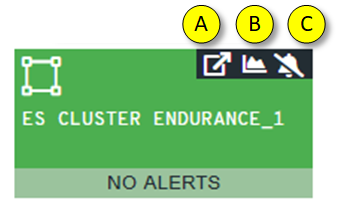
- Jump to linked page of the composite
- See statistics graph, if available for the composite
- Mute alerts of the composite
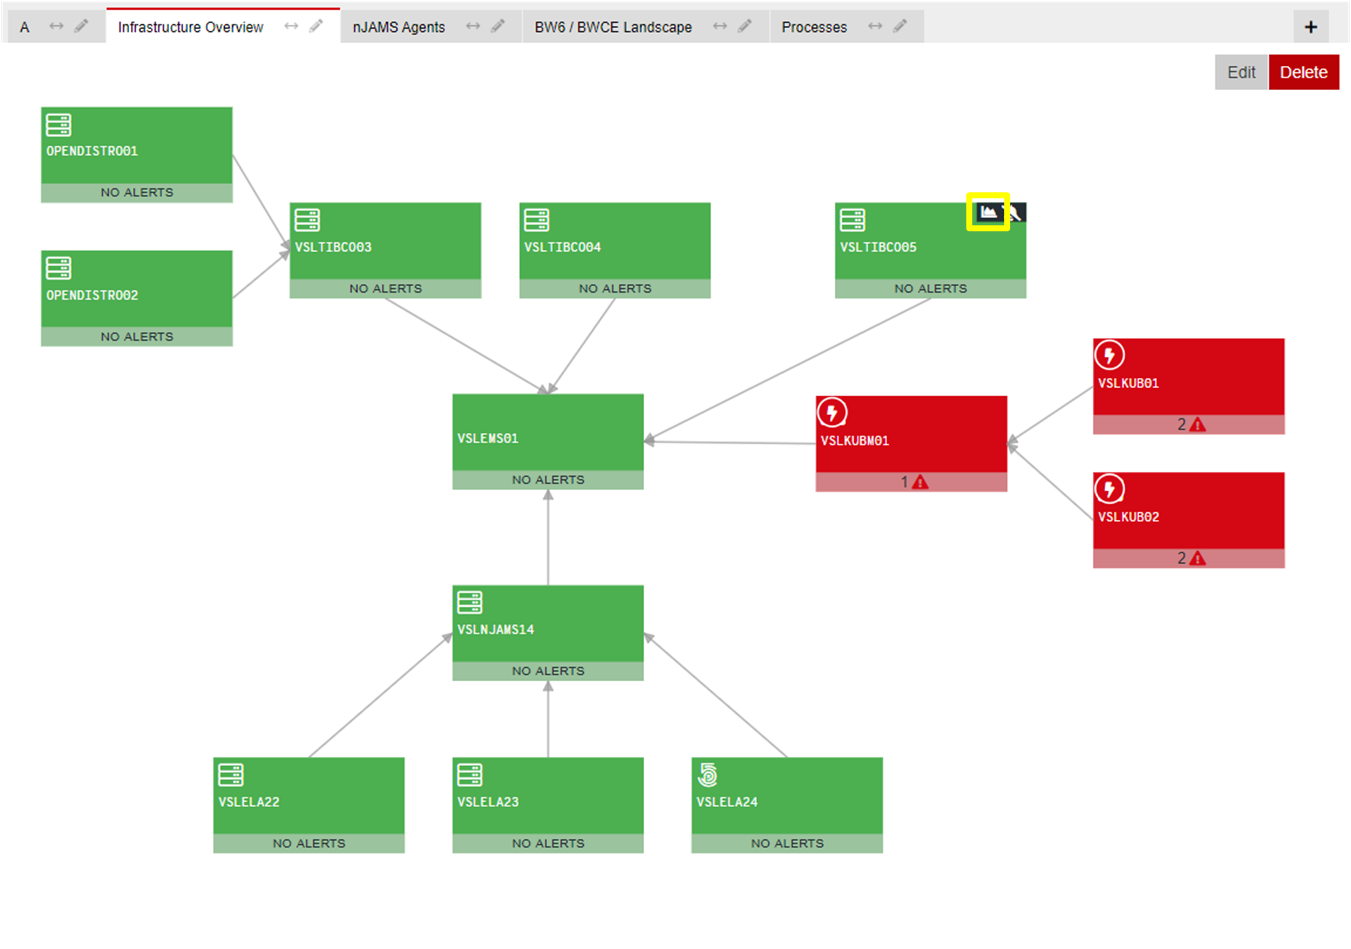
Stats graph
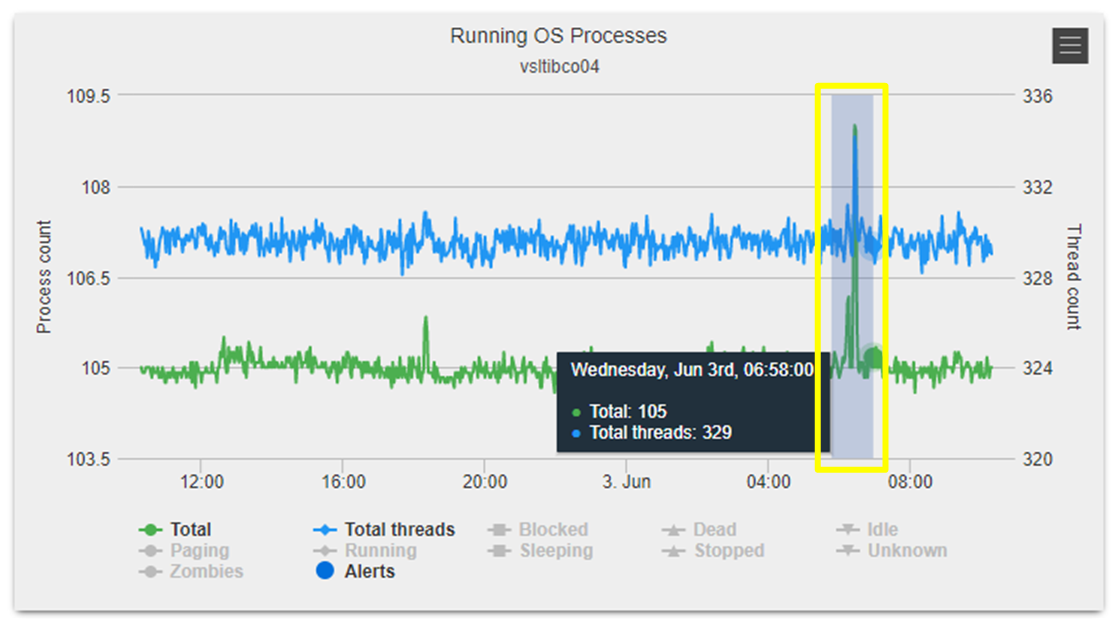
Depending on the component, you can inspect the statistics graph by clicking on the charts icon:
In this example you can see various performance statistics of a Linux machine:
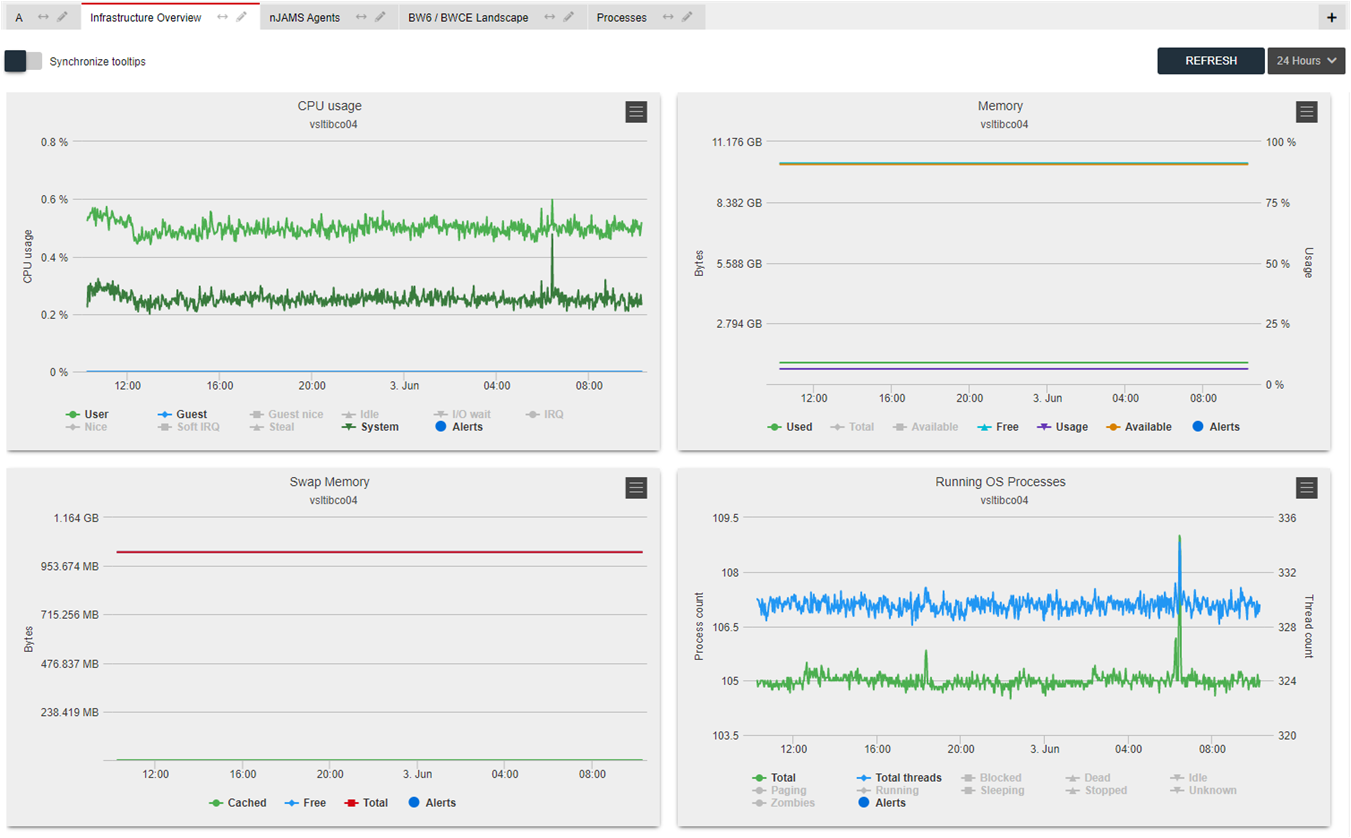
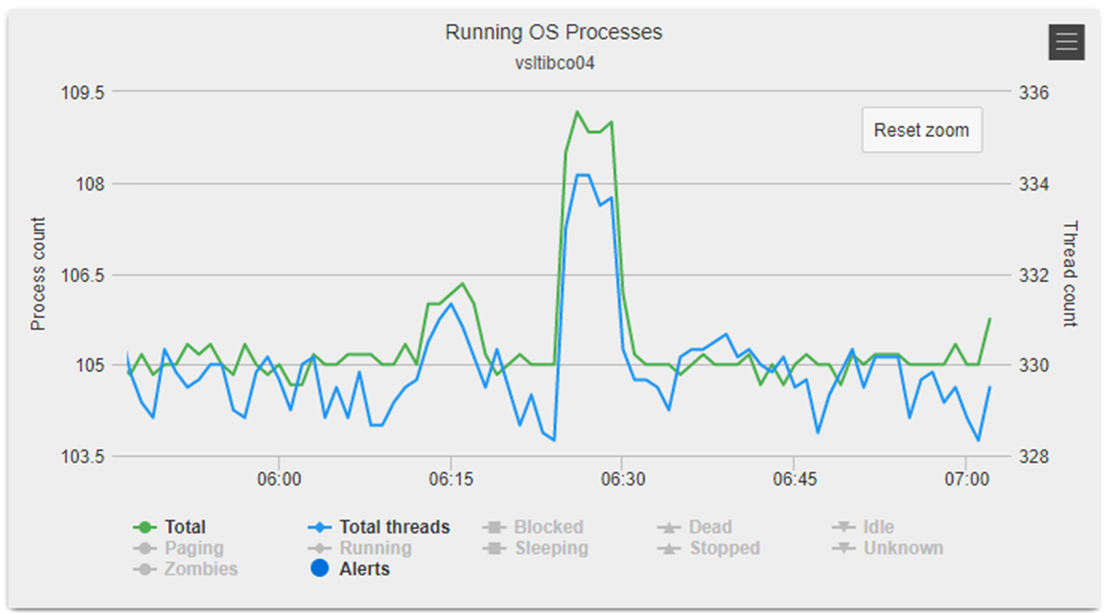
Zoom into a specific section of the chart by clicking and dragging the mouse:
After releasing the mouse button, the chart now represents the selected section:
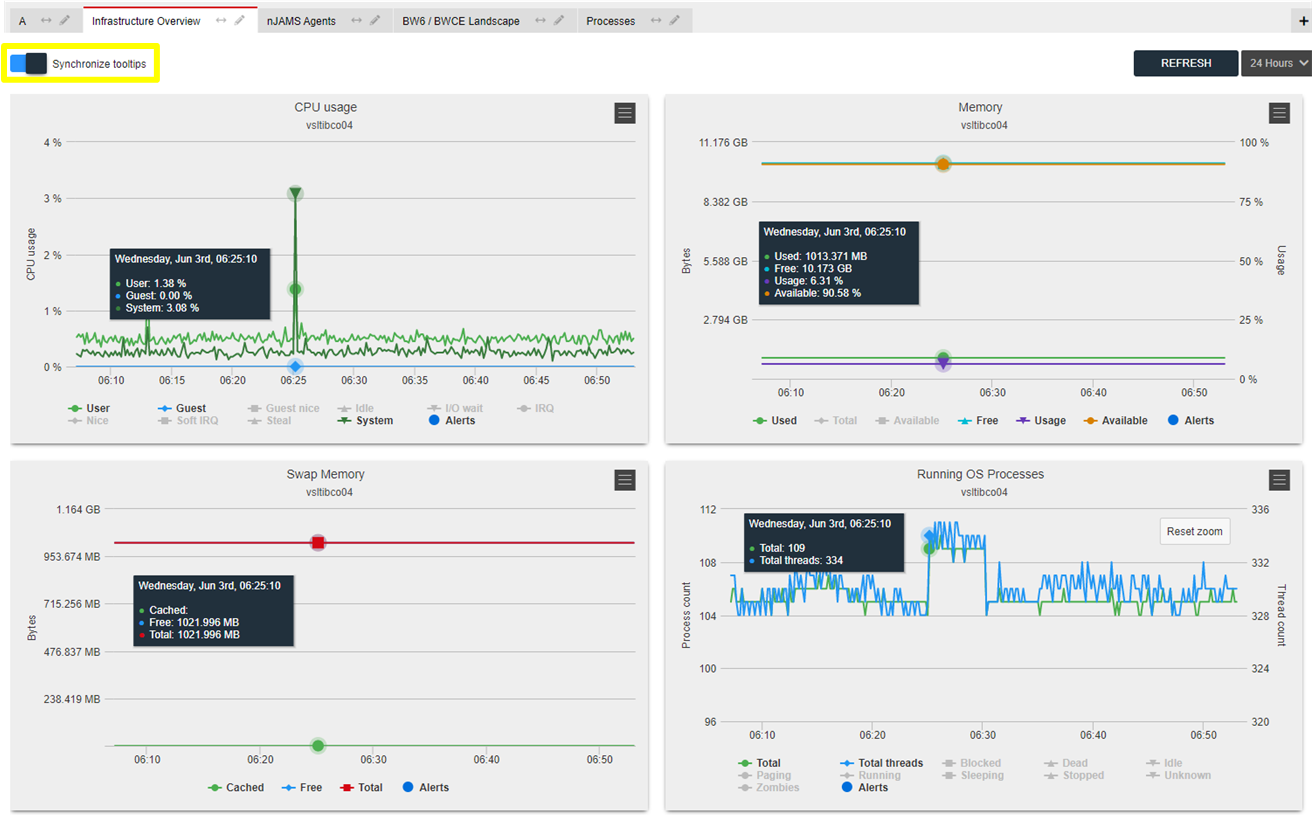
You can hover over the chart to get a tooltip with more details about this particular time. Activate Sychronize tooltips in order to see more details of all charts about this specific time. For example, this allows you to examine the memory consumption and CPU usage at the same time:
Rules
Per component you can define rules that trigger actions, if the condition is matched.
For example, you may want to trigger an alert, if the CPU usage of a machine is higher than 75%. The corresponding rule may look as follows:
if usage_user > 75 then create error alert with message "The CPU usage on host [host] is at [usage_user]%"
The formulation of a rule follows a grammar that is described in the following.
| Rule definition: | |
|---|---|
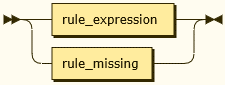
A Rule expression refers to received data from a component. On Rule missing the rule is triggered, if data is not received from a specific component. |
|
| General structure: | |
Grammar: 
Nested if … then … else: 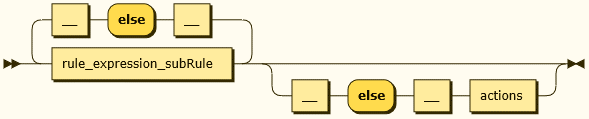
Example: if usage_user > 75 then create error alert with message "The CPU usage on host [host] is at [usage_user]%"
else if usage_user > 50 then create warning alert with message "The CPU usage on host [host] is at [usage_user]%"
|
|
| Comparators: | Building conditions and chaining them: 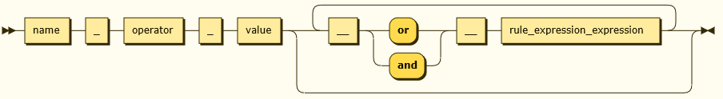
Numeric operators are: Textual operators are: Example: if usage_user > 50 and host == "vmlinux01" then create warning alert with message "The CPU usage on host [host] is at [usage_user]%"
|
| Actions: | Simple actions: 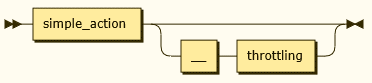
Simple actions:
Throttling:
Examples: if usage_user > 50 then create warning alert with message "The CPU usage on host [host] is at [usage_user]%" every 5 minutes
create alert (always clear alerts!): … then create warning alert with message "A warning message" else clear alert
set compoient status: … then set status to disconnected
execute a script: … then execute "/opt/myscript.sh"
chaining actions: … then execute "/opt/myscript.sh" and then set status to disconnected and then create warning alert with message "A warning message"
|
| Throttling: | Simple and complex throttling: 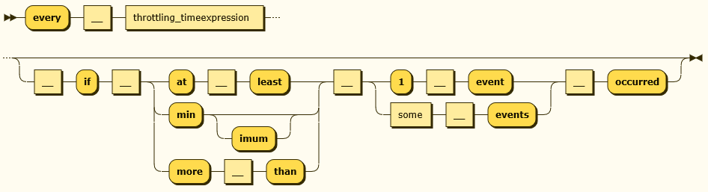
Examples: execute a script only every 5 minutes: … then execute "/opt/myscript.sh" every 5 minutes
execute a script only every 5 minutes, if at least 5 events did occur: … then execute "/opt/myscript.sh" every 5 minutes if at least 5 events occured
|
| Rule wide setting: | |
Rule wide variable: 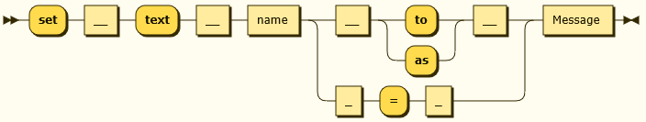
Examples: if usage_user > 75 then create error alert with message "The CPU usage on host [host] is at [usage_user]%"
else if usage_user > 50 then create warning alert with message "The CPU usage on host [host] is at [usage_user]%"
else if usage_user > 25 then create info alert with message "The CPU usage on host [host] is at [usage_user]%"
else clear alert
set text alert_message to "The CPU usage on host [host] is at [usage_user]%"

if usage_user > 75 then create error alert with message alert_message
else if usage_user > 50 then create warning alert with message alert_message
else if usage_user > 25 then create info alert alert_message
else clear alert
|
|
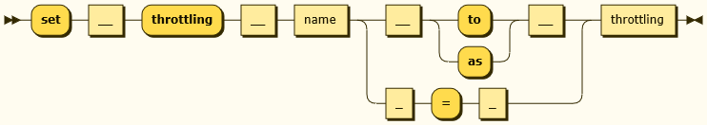
| Rule wide throttling: | |
Examples: if usage_user > 75
then create error alert with message "The CPU usage on host [host] is
at [usage_user]%" every 5 minutes
else clear alert
set throttling throttle_5 to every 5 minutes
set text alert_message to "The CPU usage on host [host] is at [usage_user]%"

if usage_user > 75
    then create error alert with message alert_message
    using throttling throttle_5
else clear alert
|
|