Reports
The tab “Reports” presents useful statistics around nJAMS objects. The statistics are related to the selection in the Tree.
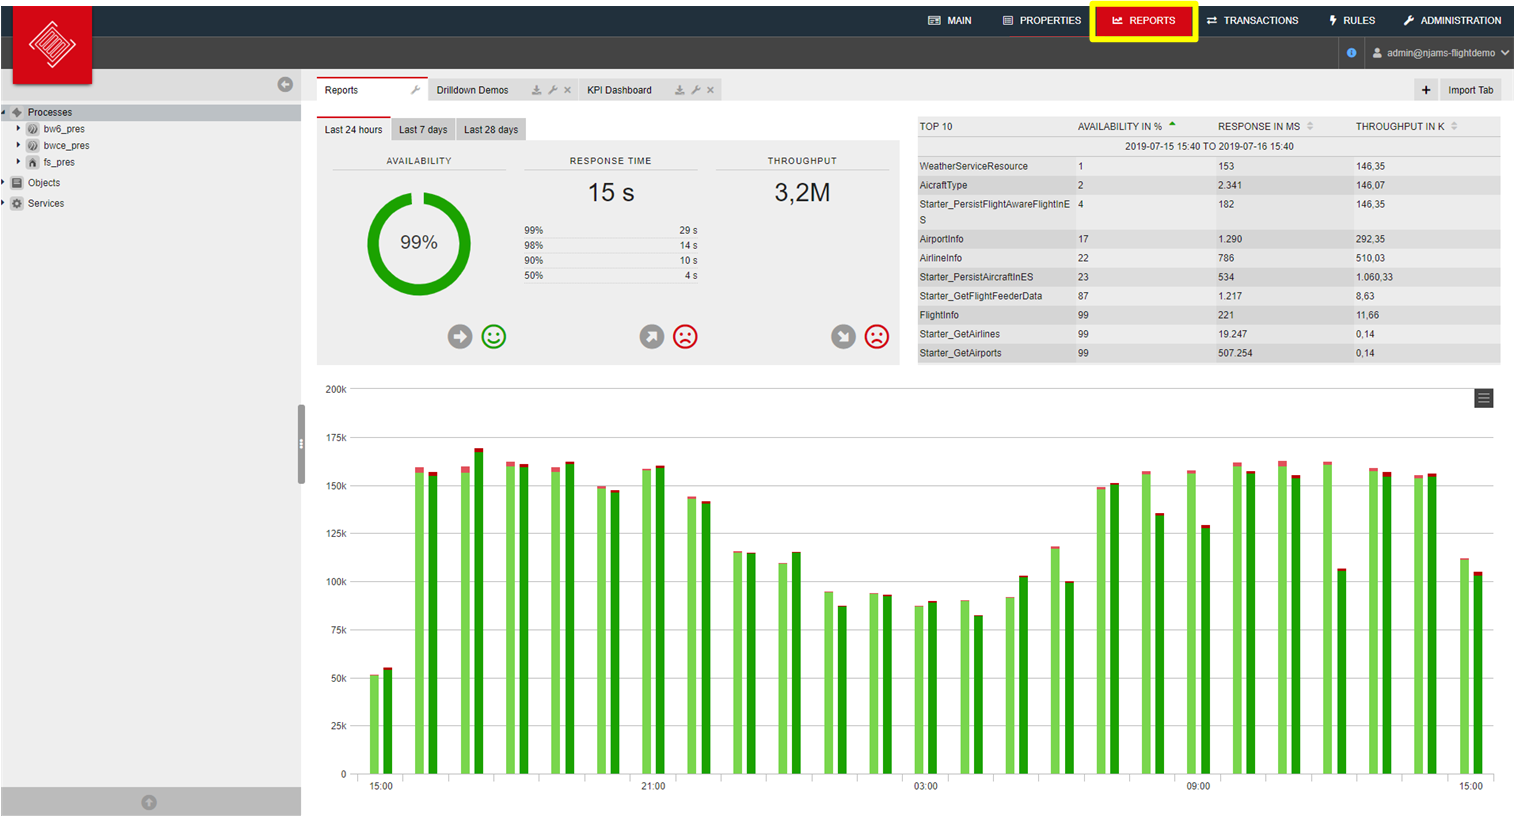
With exception of Queries you can select any type of element from the Tree to show the Report.
Performance: The header of the Report contains statistics about the performance of the selected object.
The performance statistics consider three different periods of times, which are placed on different tiles:
- Last 24 hours
- Last 7 days
- Last 28 days
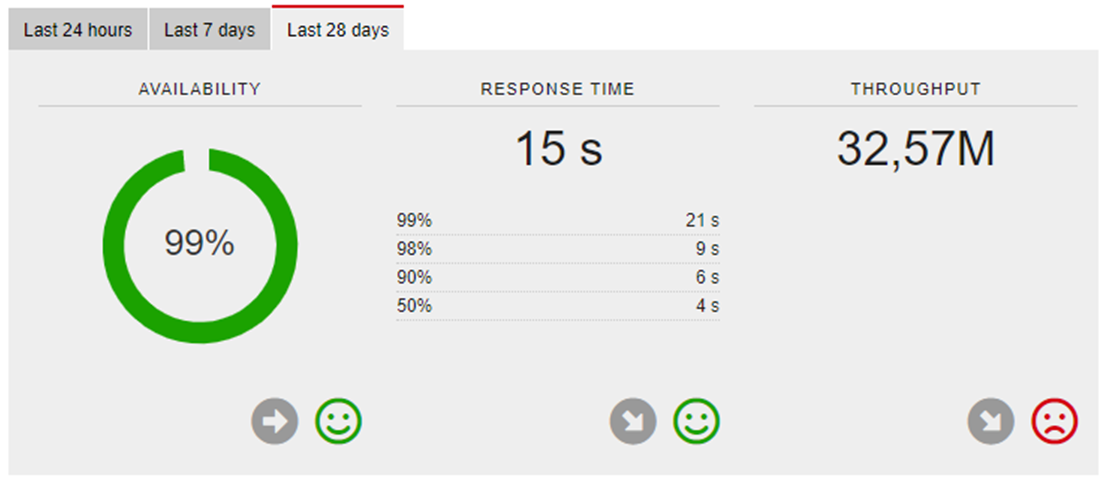
For each tile the following statistics are presented according to the specified time frames:
Availability: The Availability is 100%, if there are no Events received with status warning or error within the given period of time. The arrow below indicates the trend compared to the previous period of time. Response Time: The Response Time represents the average response time of the process executions regarding the selected object within the given period of time. The following percentiles are listed below: 99%, 98%, 90%, and 50% of the response time, followed by the trend indicator. Throughput: The Throughput represents the number of process instances related to the selected object that are executed within the given period of time. The following statistics are calculated depending on the selection of the performance tile (24 hours, 7 days, 28 days).
Top 10: The Top 10 list represents the top 10 process instances as measured by Availability, Response Time, or Throughput. The Top 10 list considers the period of time selected by the performance tile. The following example lists the top 10 process instances ascending by Availability regarding the last 24 hours of the selected object from the Tree:
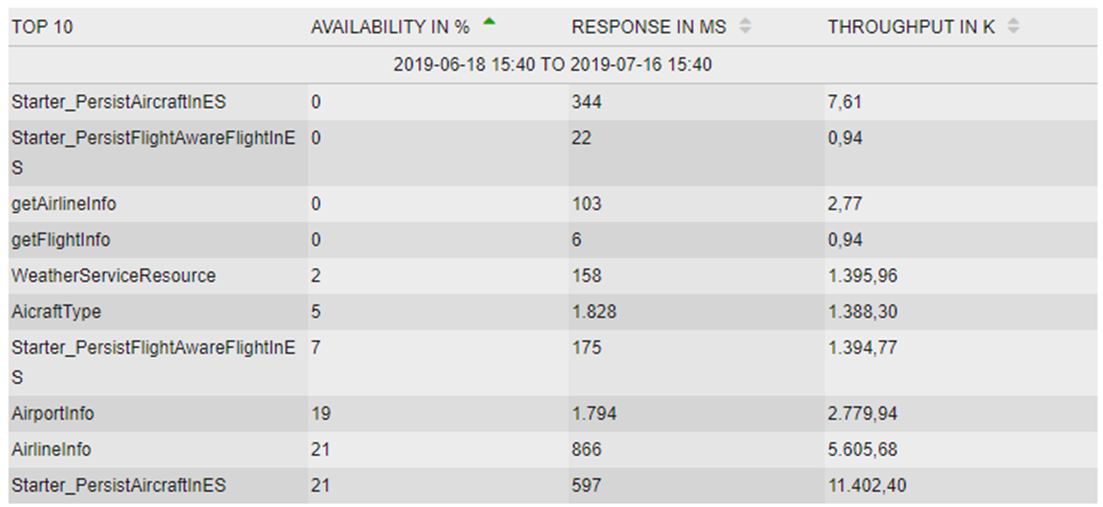
You may click on a different header of the Top 10 list to see the corresponding top 10 processes and you may select a different sort order.
Throughput: The Throughput diagram list represents the number of process instances related to the selected object. The Throughput diagram considers the period of time selected by the performance tile. The following example shows the Throughput of the last 24 hours compared the the previous period of time:
The bar chart in the foreground represents the current period of time, the area diagram in the background represents the previous period of time.
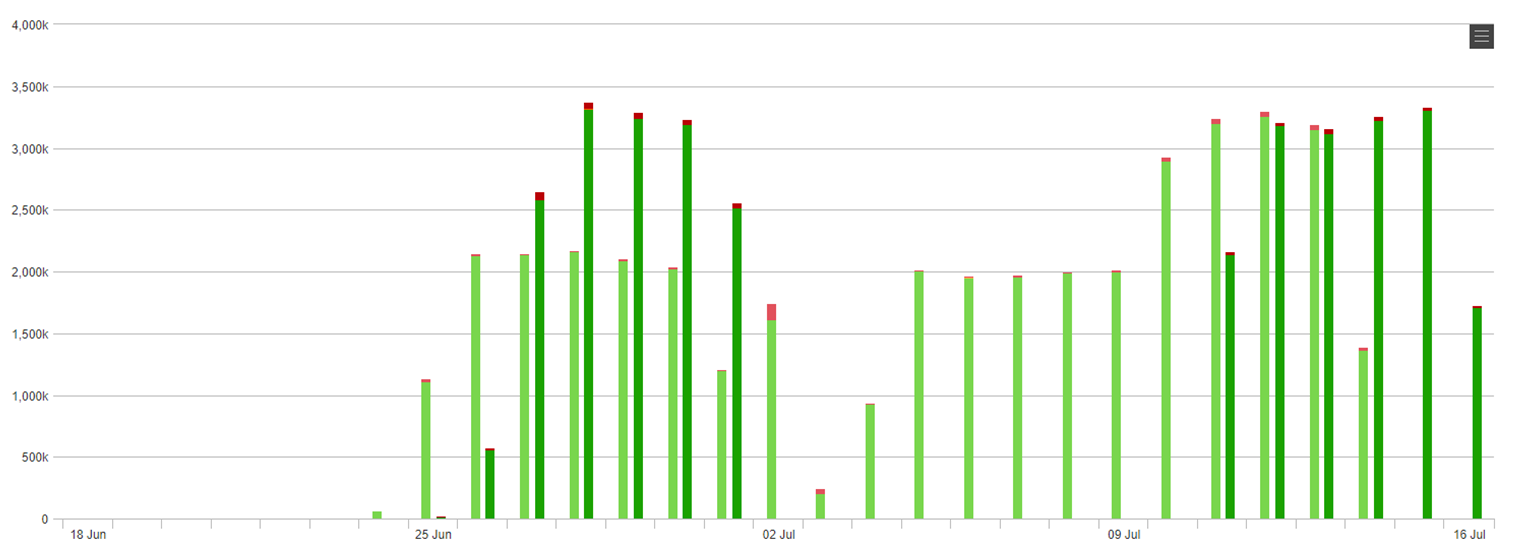
Total Count: The Total Count diagram is a detailed view of the number of messages processed by nJAMS Cloud related to the selected object from the Tree within the given period of time according to the selected performance Tile:
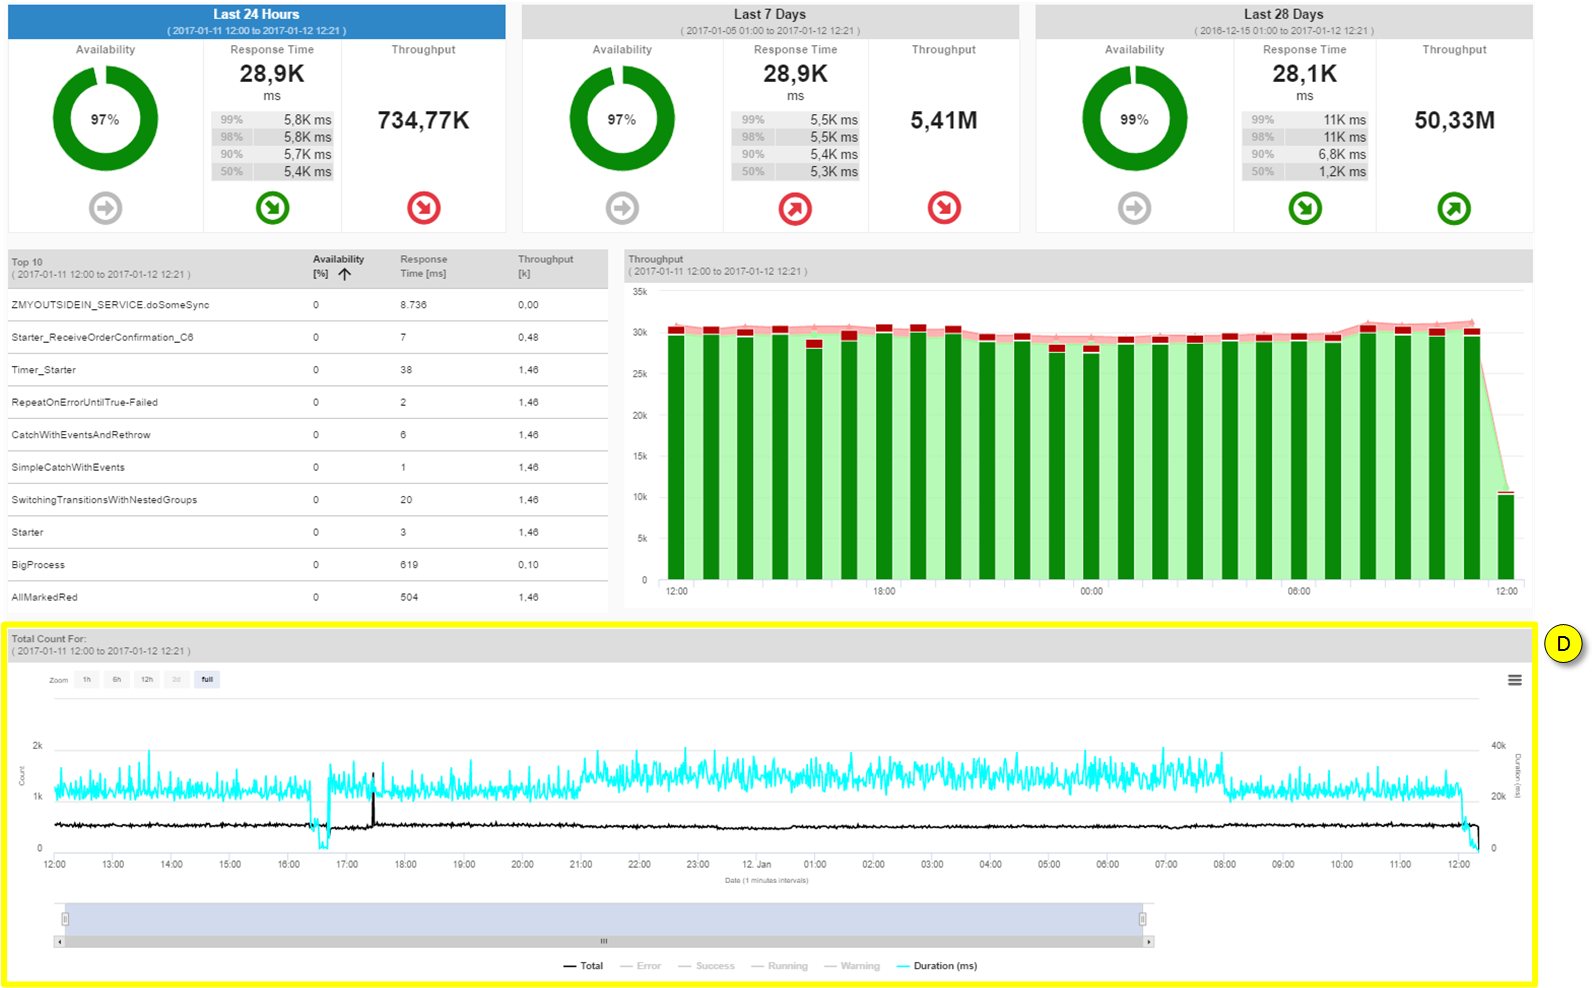
You can interact with this diagram by clicking into the diagram and dragging to zoom into a individual time window.
Scheduled Transaction Report: The Scheduled Error Report allows you to frequently receive an Error Report for a specific application by email. For example, you may want to get a report every morning about errors of an application from the previous day.
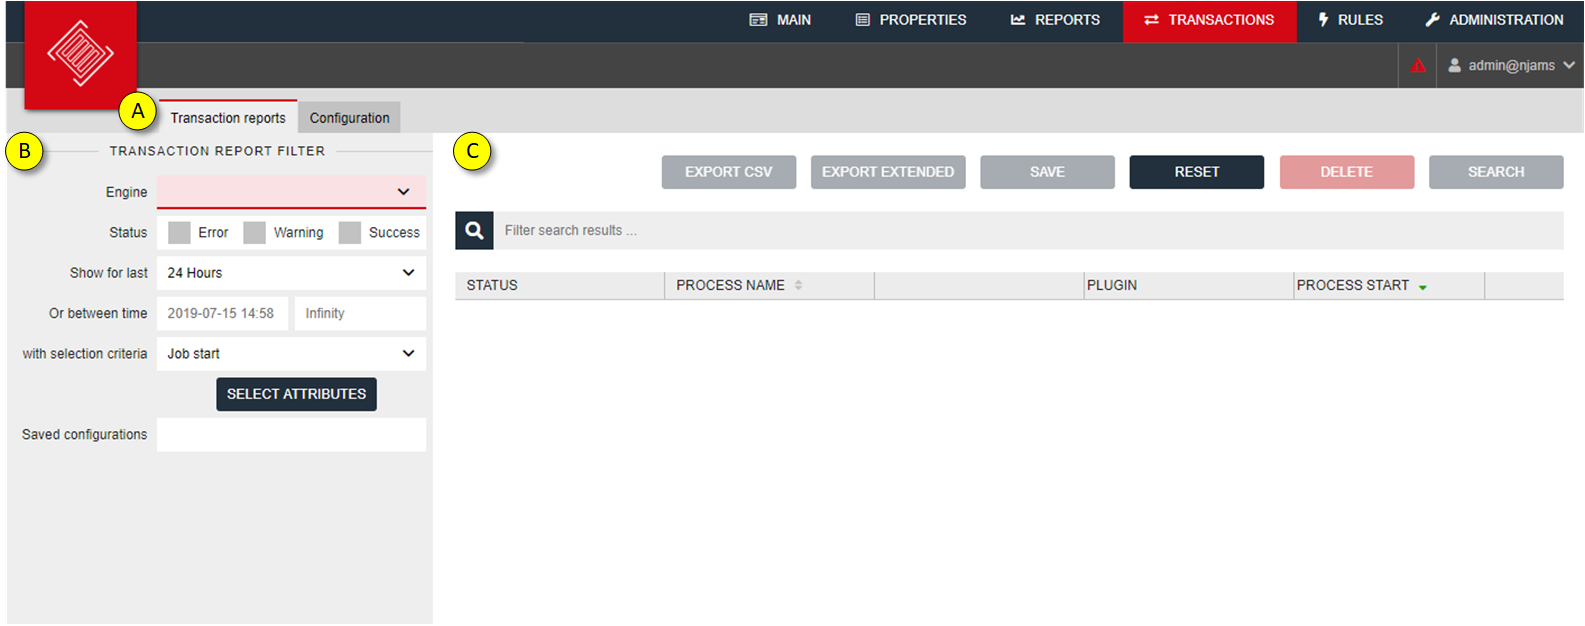
- Transaction Error Reports are based on a particular application and a period of time. Configuration is used to define a schedule to frequently generate an Error Report.
- Filter criteria for the Error Report
- Search results according to filter
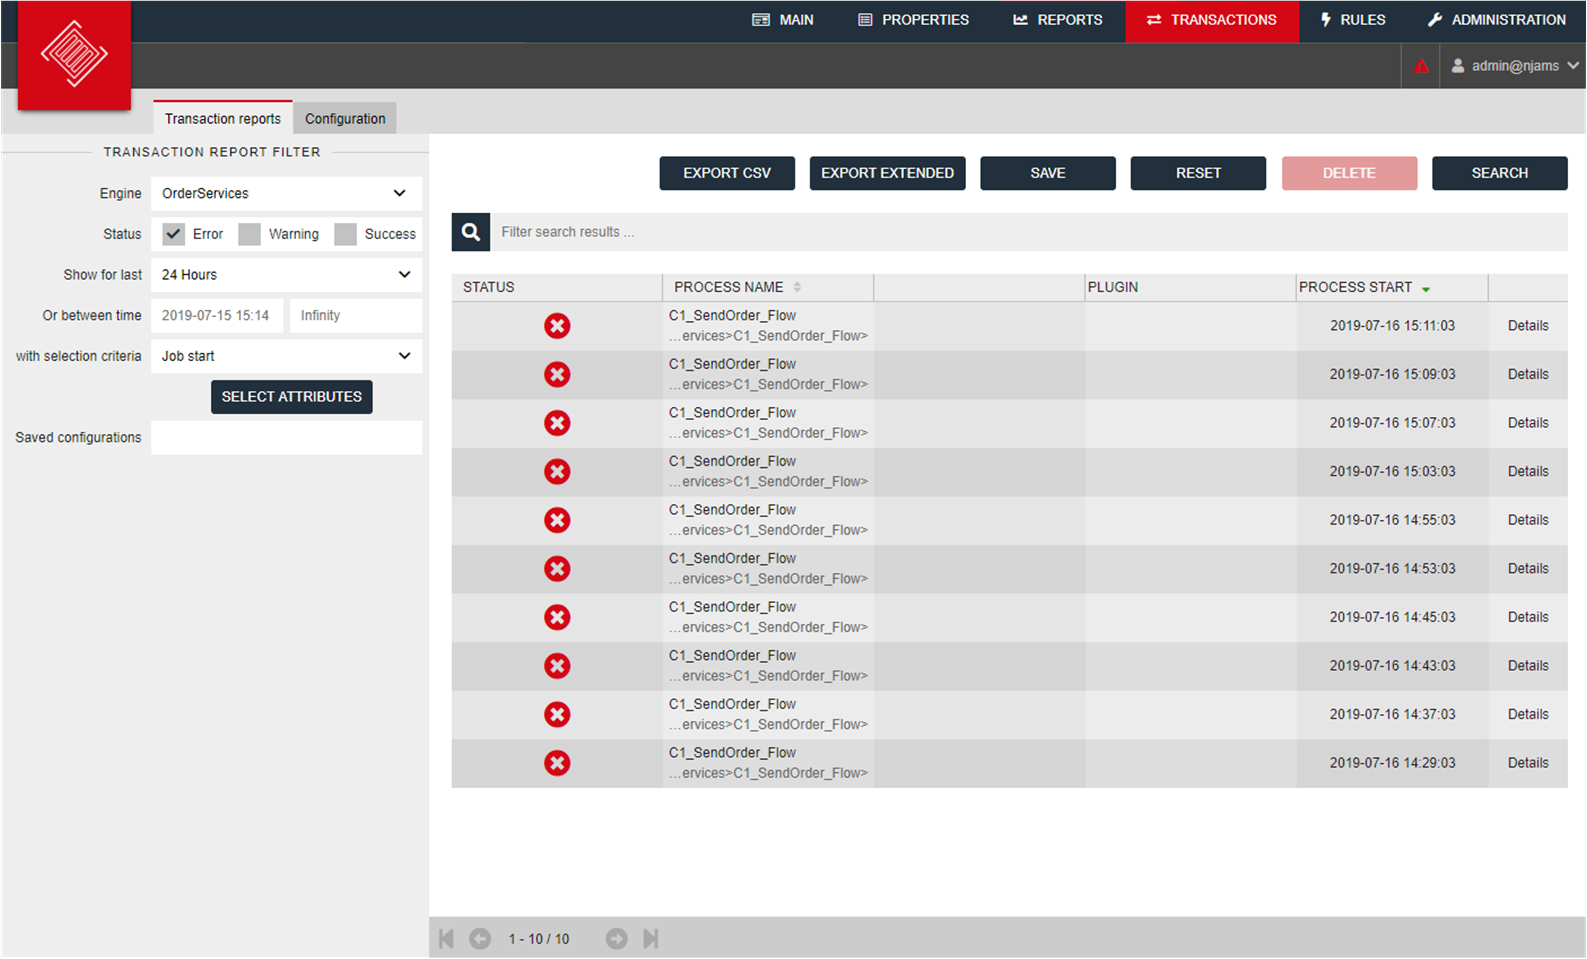
The following example represents an “Order Report”, which applies to application “Order Orchestration” and returns the errors of the last 24 hours:
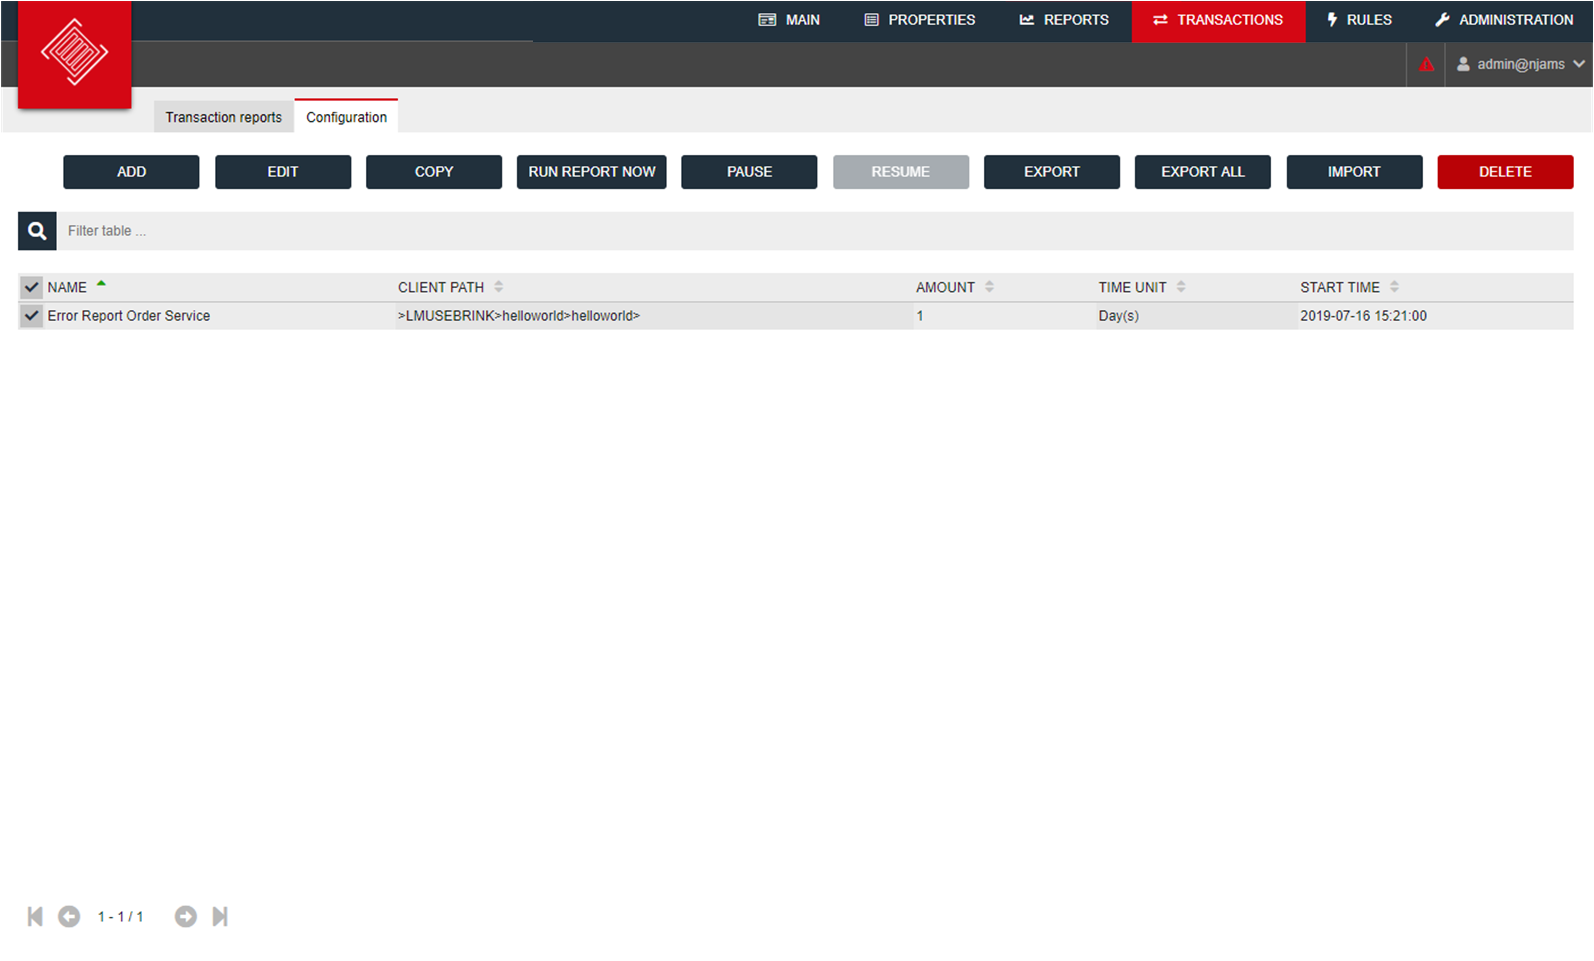
The following Configuration schedules the “Error Report Order Service” every 15 minutes:
by sending an email to members of a Role:
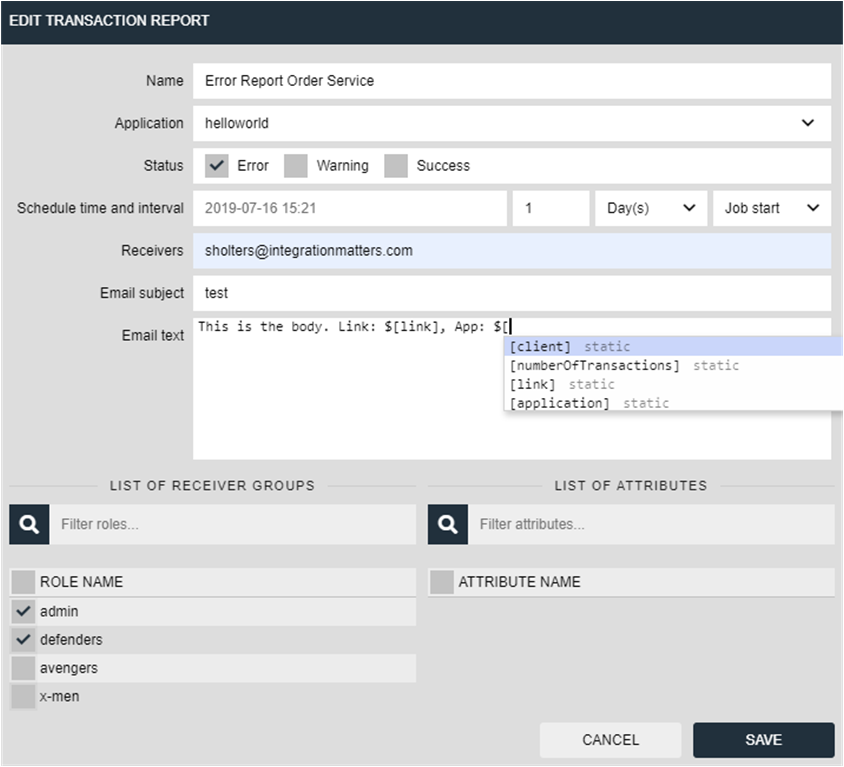
The email body may contain placeholders for the
- corresponding nJAMS Client
- total numbers of errors
- link to the Error Report within nJAMS Cloud