Message Processing#
The Message Processing page represents an overview of how nJAMS Server is processing log messages:
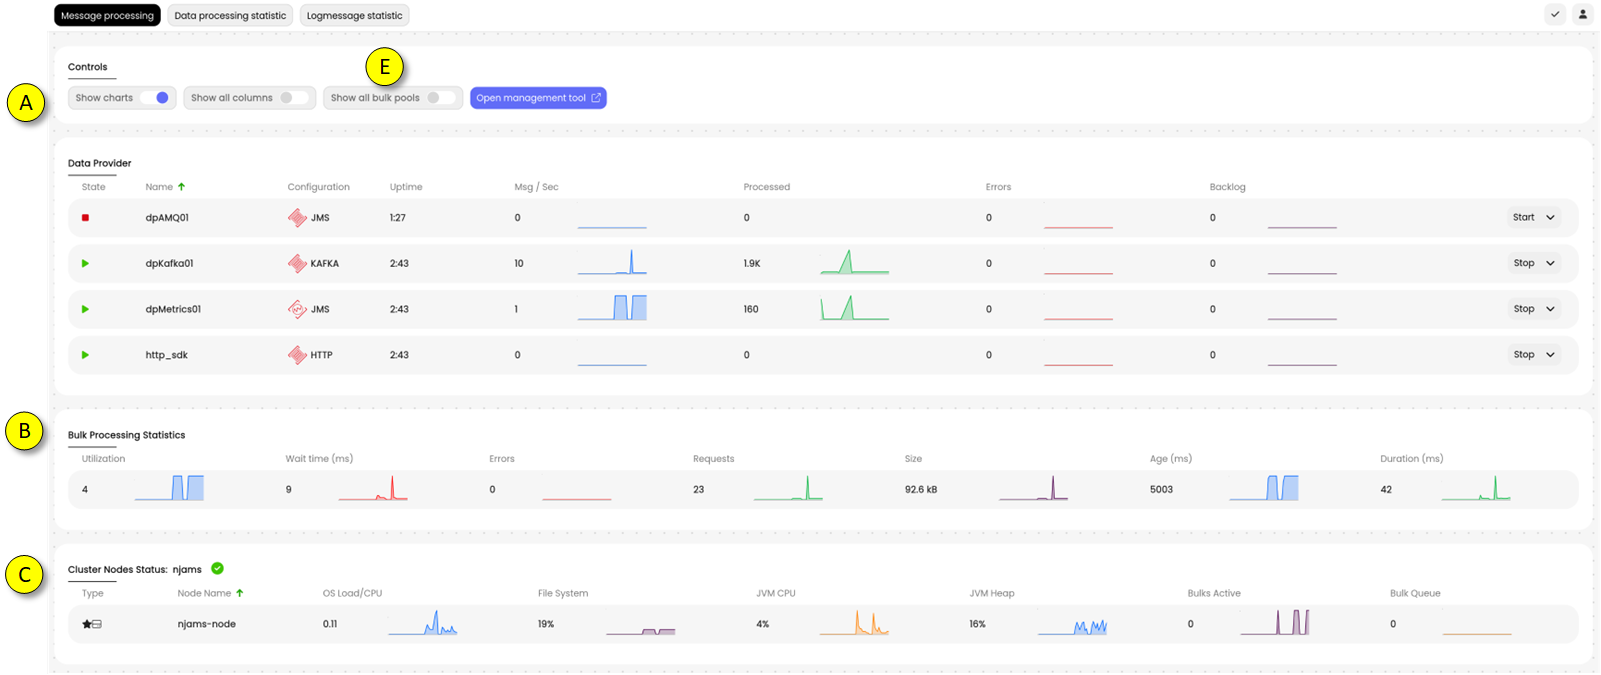
(A)Overview of all Data Provider instances and their states
(B)Bulk Processing Statistics provides statistics of Indexer’s performance.
(C)Cluster Nodes Status represents a list of all Elasticsearch Nodes combined to an Elasticsearch cluster.
- Data Provider:
The example below shows 4 Data Providers, 3 DPs are started and 1 DP is stopped:
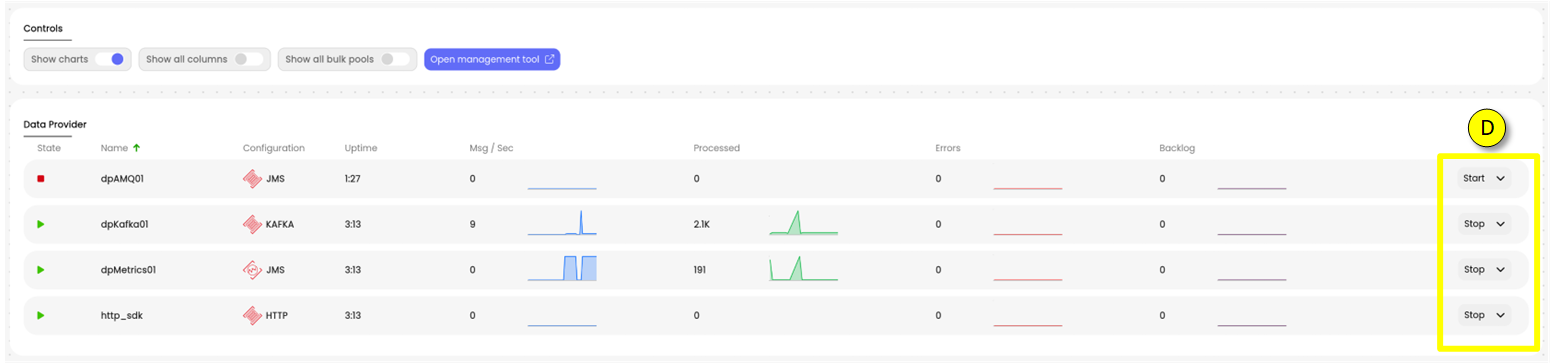
(D)Select a Data Provider in order to START/STOP the Data Provider. Furthermore you can edit the Data Provider configuration by clicking on CONFIGURE.Press RETRIGGER ERRORS to resend messages from error queue.
The DP list provides the following information:
Column
Description
State
Running: Data Provider is processing log messages
Stopped: Data Provider does not process log messages
Name
Name of the Data Provider
Configuration
Type of the Data Provider and its used type of connection
Threads
Number of threads used by the Data Provider
Uptime
Uptime since last start of Data Provider
Msg / sec
Number of log messages being processed per second
Processed
Number of log messages being processed since last start of Data Provider
Errors
Number of errors occurred since last start
Destination Size
Number of current log messages on the event destination that are pending
Error Destination
Number of log messages in error queue. Log messages will be forwarded to error queue, if
Size
nJAMS Server cannot parse or process them successfully
Note
When a Data Provider is stopped, the communication channel to nJAMS Clients is still active. You are still able to enable Tracing on nJAMS Client, for example.
- Bulk processing:
The indexing status depends on data provider activity. As long as at least one data provider is running, the indexing of new messages is running also. This is not to be mixed up with the indexer connection, which is also responsible for searching and providing Log Messages.

(E)Shows the state of Indexing documents.Column
Description
Utilization
Average number of data processing threads feeding data into each indexing thead.
Wait time
Accumulated time in [ms] that requests for a bulk-processor to become available.
Error
Total number of errors that occurred on indexing documents since indexing was started.
Requests
Number of indexing requests per bulk.
Rejections
Number of rejected indexing requests per bulk.
Size
Approximated bulk request size.
Age
Approximated bulk request age in [ms].
Duration
Overall bulk request processing duration in [ms].
Throttle time
Summarized time bulk processing was suspended since indexing was started.
- Cluster Node Status:
This section represents the condition of the Elasticsearch cluster:

(F)Shows the condition of the entire cluster.Column
Description
Node Type
Data Node
Client Node
Master Node
Eligible Master Node
Node Name
Name of the Elasticsearch Node
OS Load
Operating System load
OS Memory Used
Operating System memory usage in percentage
CPU
CPU utilization in percentage
JVM Heap Unit
JVM Heap usage in percentage
File System Used
Storage used on file system of machine where Node is running
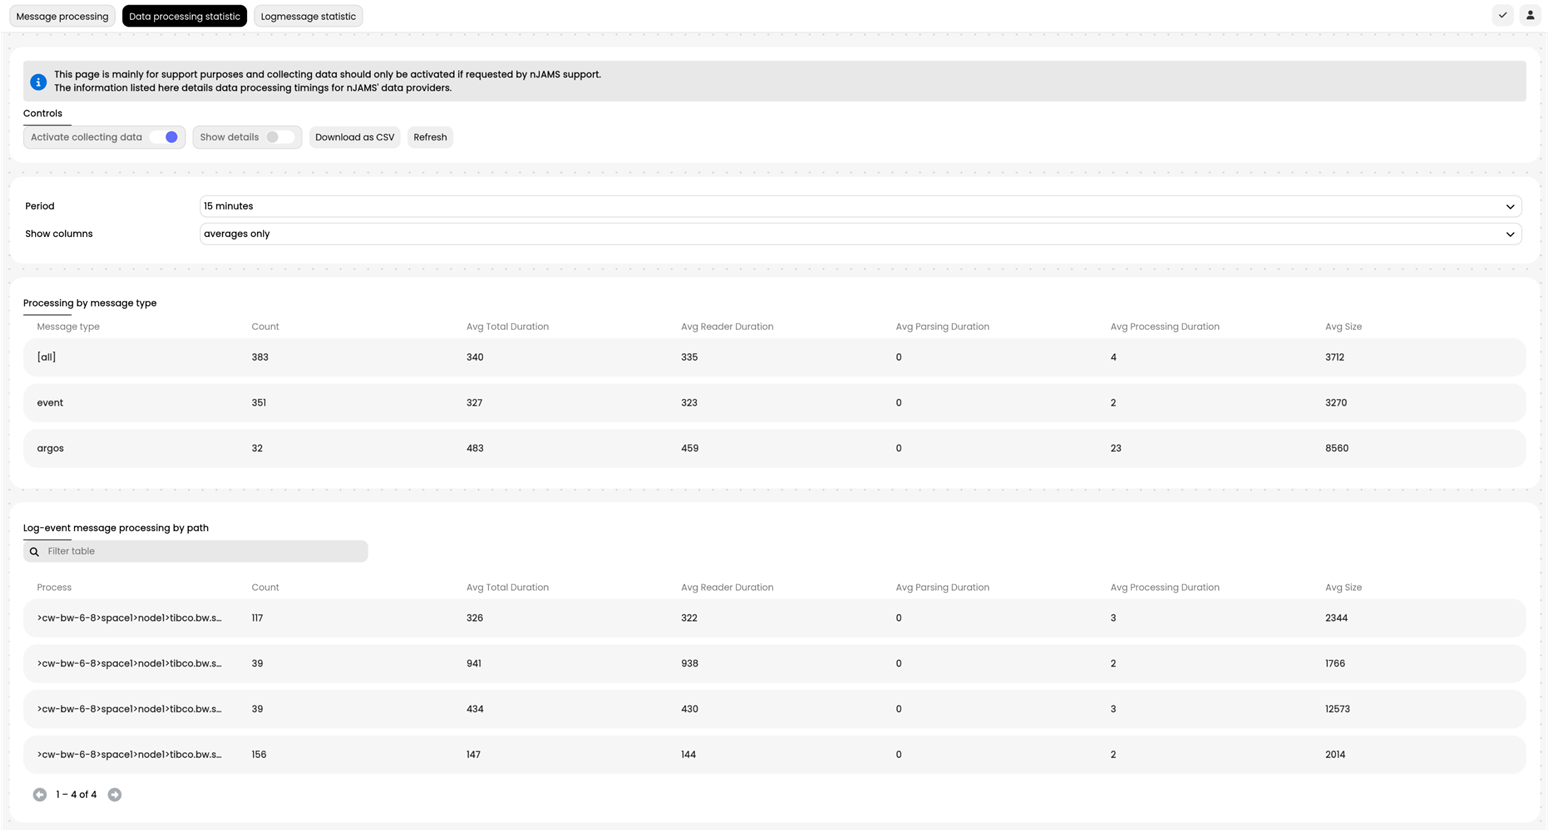
- Data Processing Statistics:
The Data Processing Statistics provide additional details per domain object. Collecting Data Processing Statistics is disabled by default. In case you need a deeper insight of nJAMS message processing you can turn on the statistics. The Data Processing Statistics can be downloaded for better analysis.
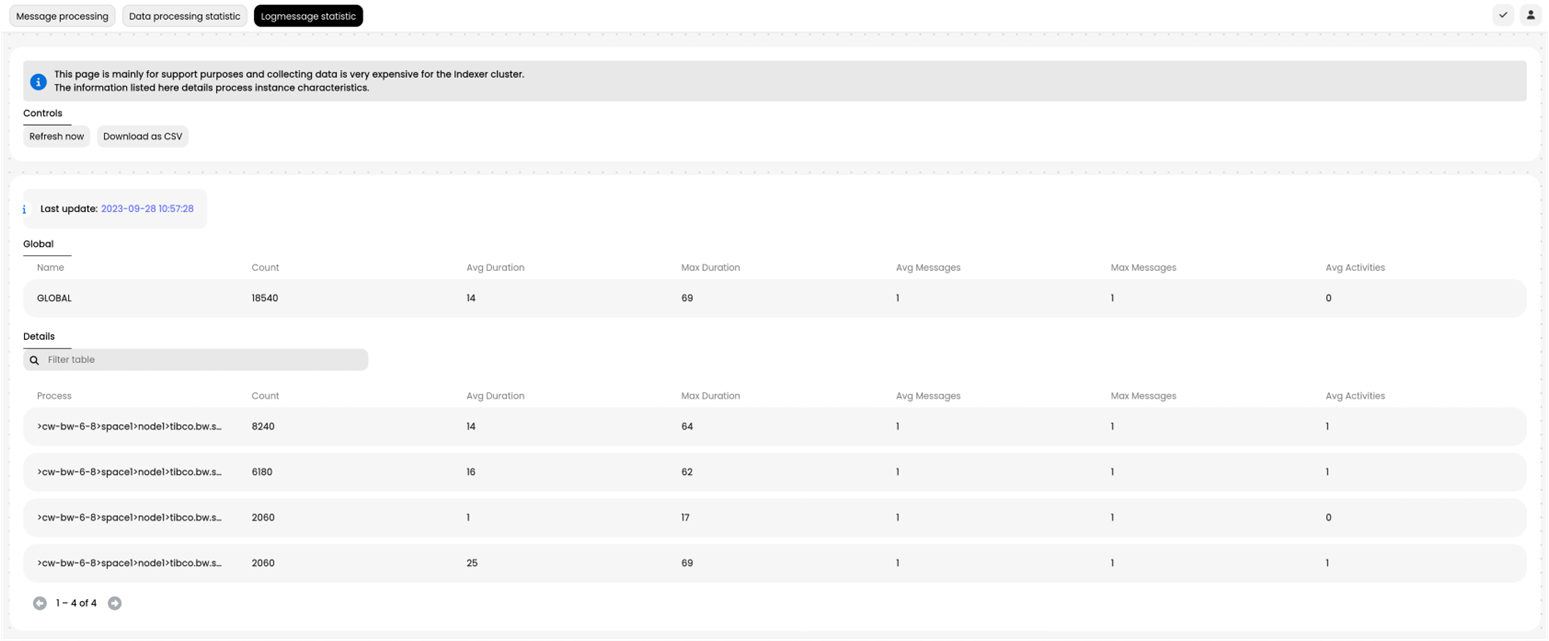
- Logmessage Statistics:
The Logmessage Statistics provide detailed information about the log messages nJAMS Server receives per domain object: The Logmessage Statistics can be downloaded for better analysis.