Introduction#
Architecture#
Before you begin with Argos, please get an idea of the architecture of Argos.
Argos is supplied with data from nJAMS Agent. nJAMS Agent is a standalone binary that collects metrics from various sources.
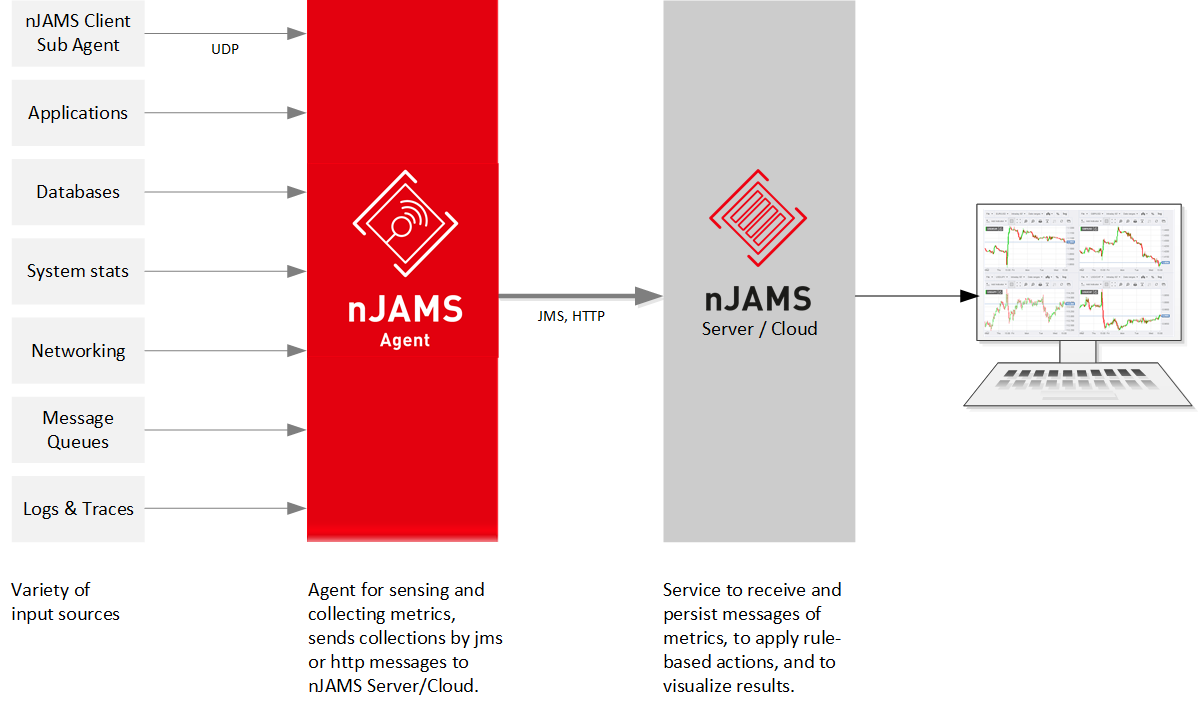
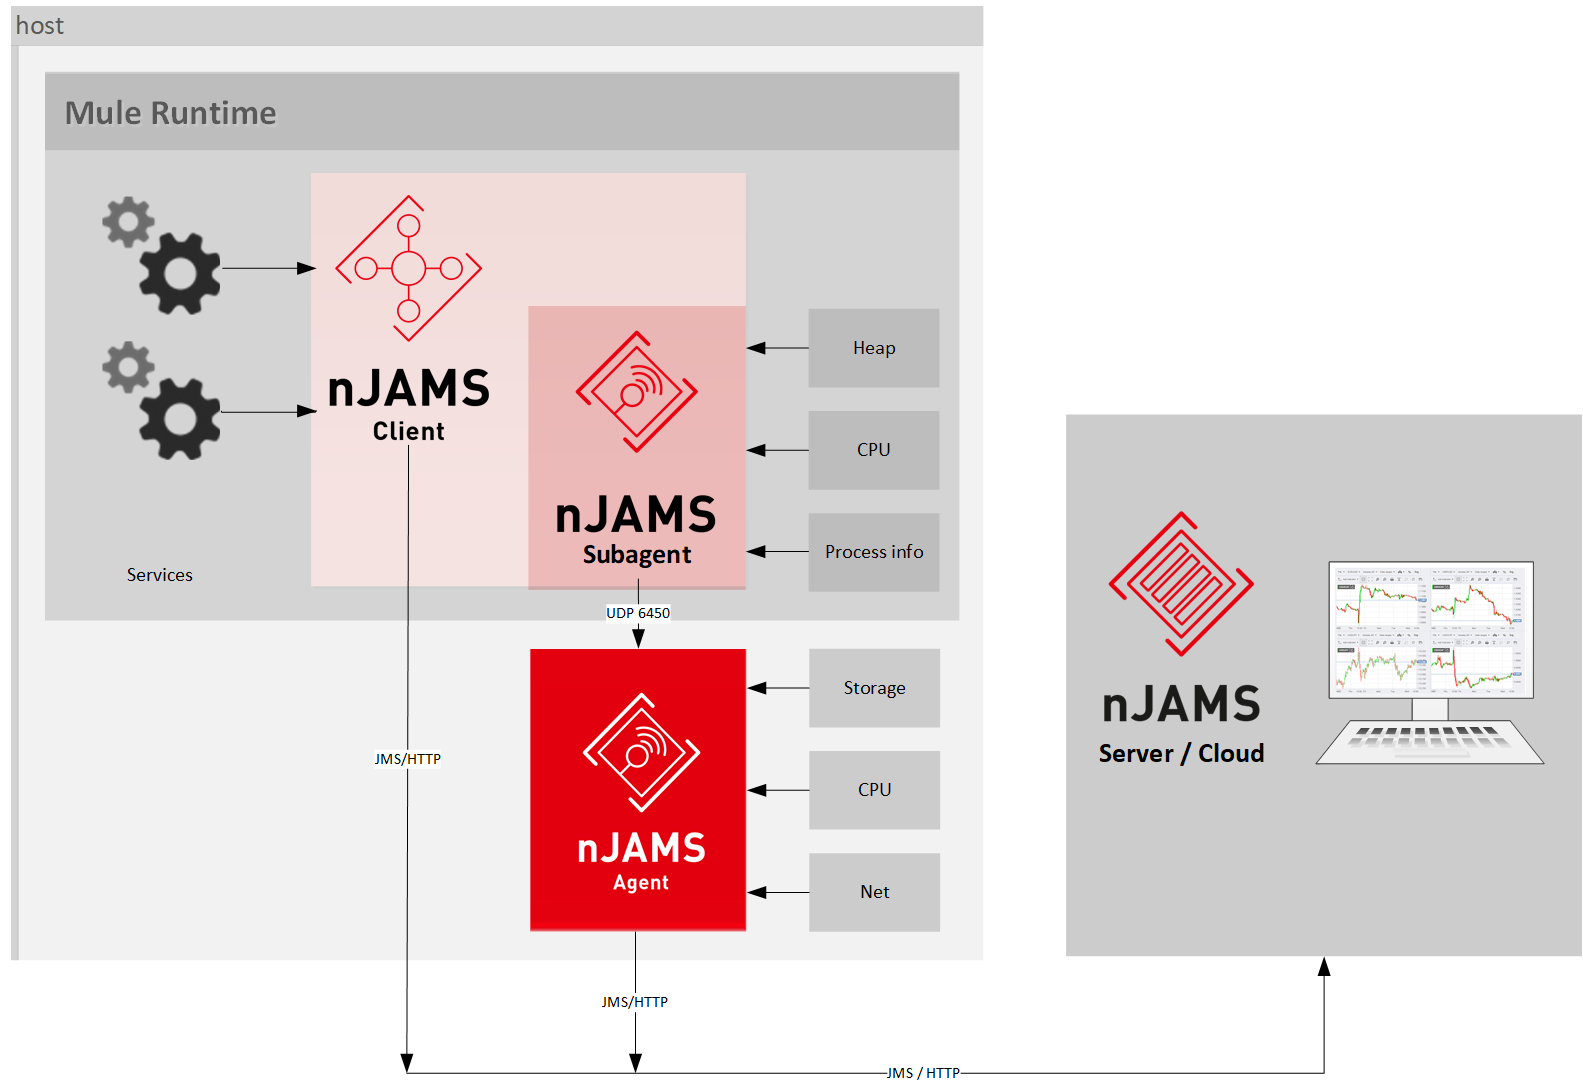
One of the input sources for nJAMS Agent is the Subagent of nJAMS Client. Current versions of nJAMS Clients have a built-in Subagent that communicates with nJAMS Agent. The Subagent can collect metrics from inside of the runtime environment of the monitored system. The following figure shows exemplary how nJAMS Client monitors process transactions of services from the MuleSoft® Runtime Environment and nJAMS Subagent measures various metrics of Mule Runtime at the same time. In addition, nJAMS Agent collects metrics from outside of the Mule Runtime, respectively from the host:
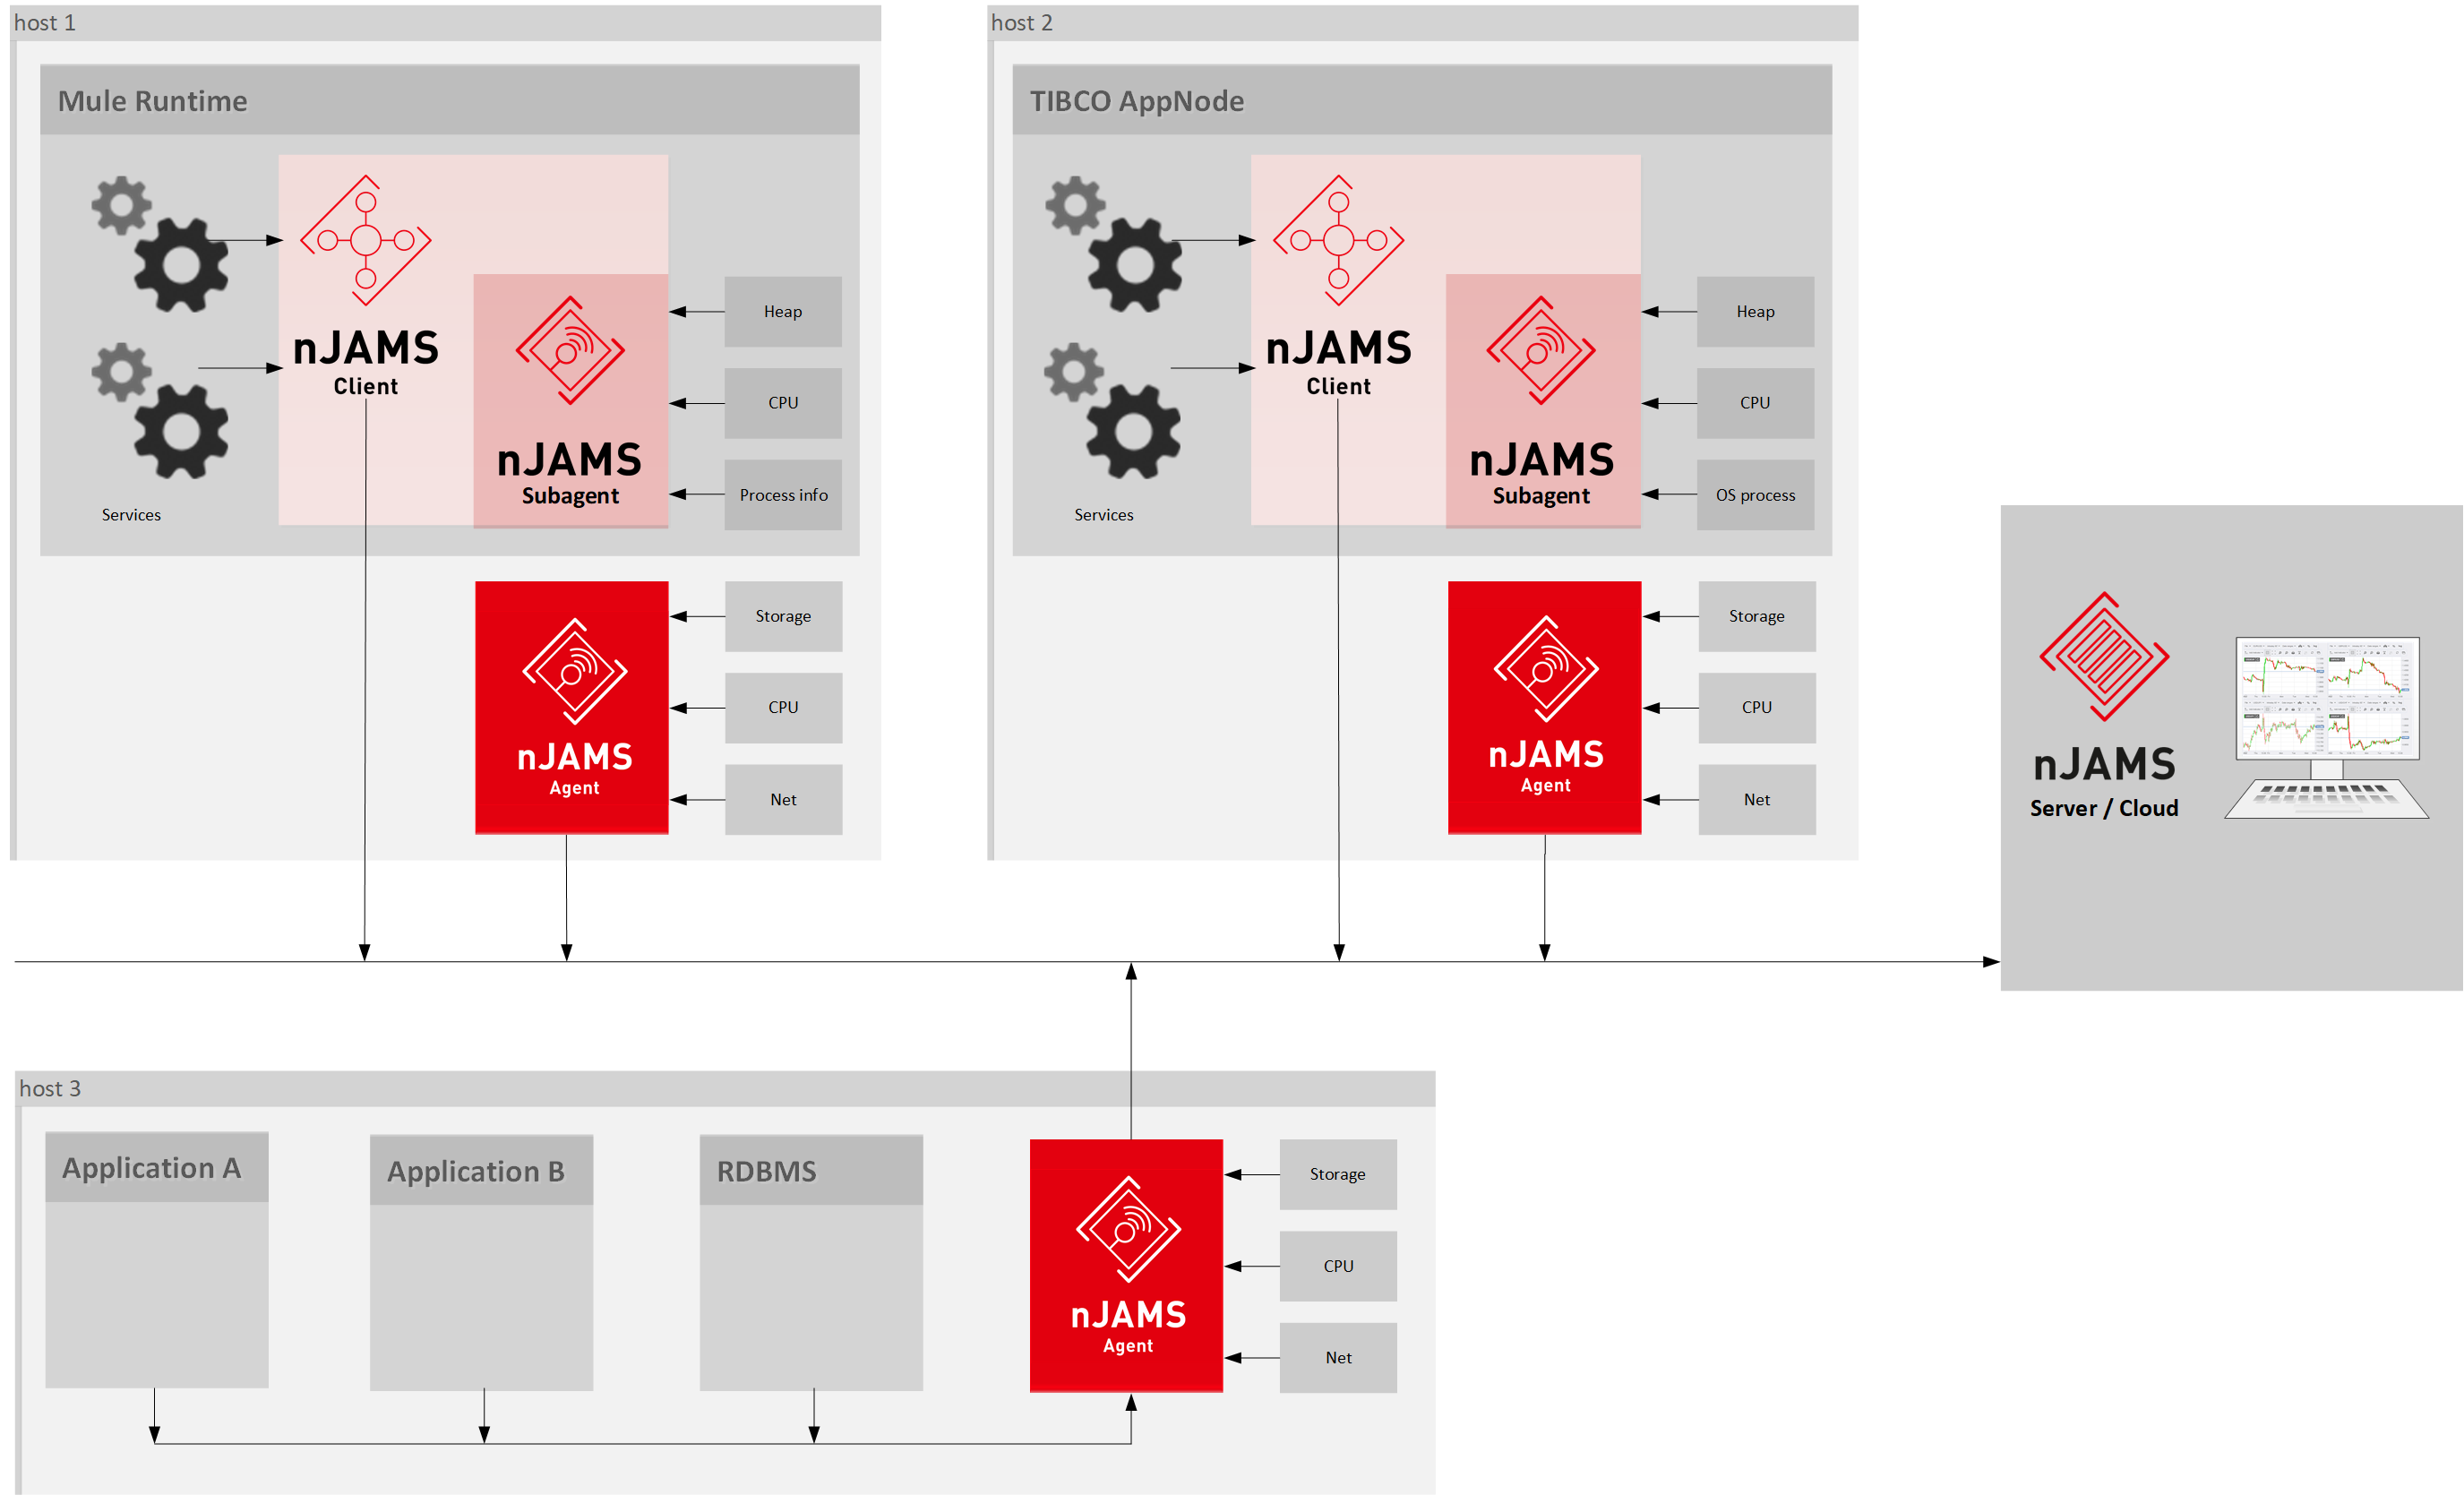
The following figure illustrates the distributing monitoring capabilities of nJAMS in connection with Argos. nJAMS Clients and nJAMS Agents collect events and metrics from your entire environment and pass the information to nJAMS Server / Cloud, the central service of nJAMS.
Please refer to documentation of nJAMS Agent for more details about the capabilities of nJAMS Agent in general and the configuration of nJAMS Agent in particular.
Argos Data Provider#
Argos requires a connection to nJAMS Agent to be supplied with metrics data. As usual in nJAMS, a Data Provider has to be configured.
Go to nJAMS GUI and enter Administration > System Control > Data providers. Click ADD to create a new Data Provider for Argos:
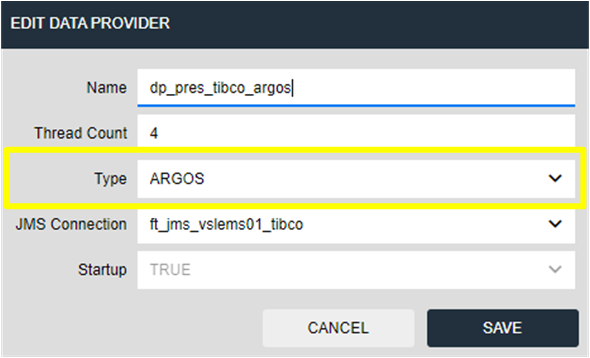
Make sure the Data Provider is of type ARGOS. Use a JMS connection that listens to the corresponding destination of nJAMS Agent.
Save the new Data Provider and start the Data Provider at Administration > System Control > Message processing:
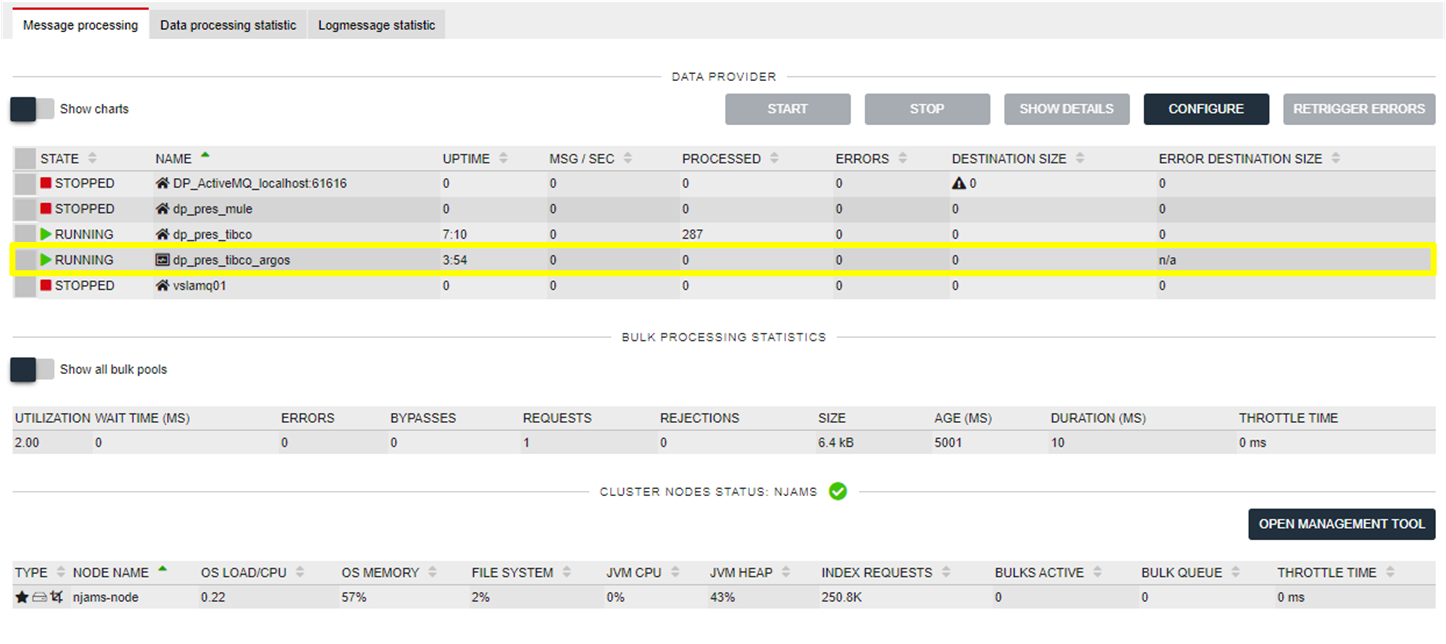
Once you configured and started an Argos Data Provider and made sure an nJAMS Agent is running properly, you can create your first Argos dashboard.
Argos dashboard#
Let’s start from scratch with a blank dashboard. The following steps demonstrate a procedure for a simple scenario. We want to create a new dashboard containing a page with a simple component that should indicate an alert, if a TIBCO BusinessWorks 6 AppNode is unavailable.
- 1. Create a new dashboard:
Go to nJAMS GUI and select tab
Argos.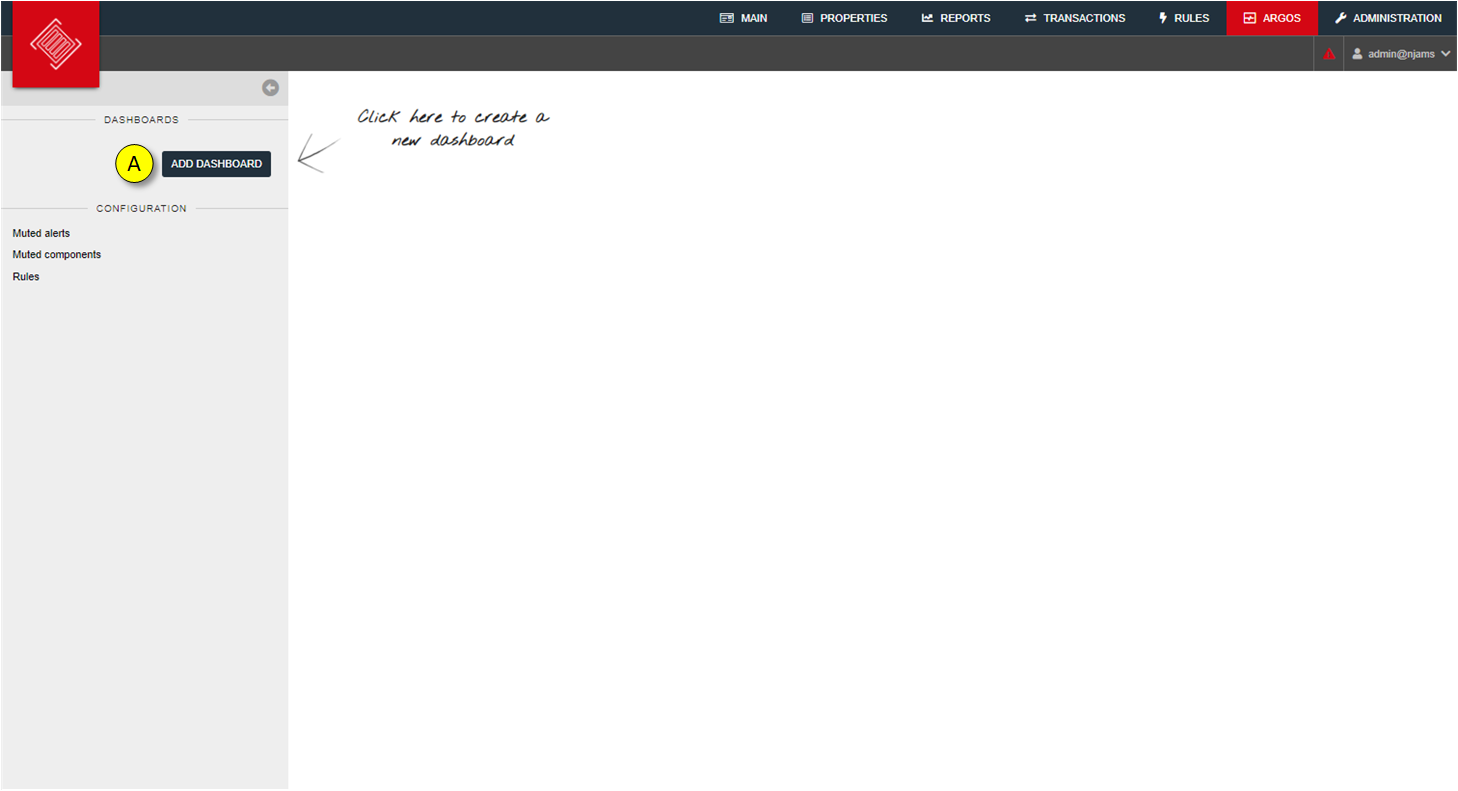
Click on
ADD DASHBOARDto create a new ARGOS dashboard.
- 2. Add page:
Add a page to the dashboard. A dashboard can consist of multiple pages.
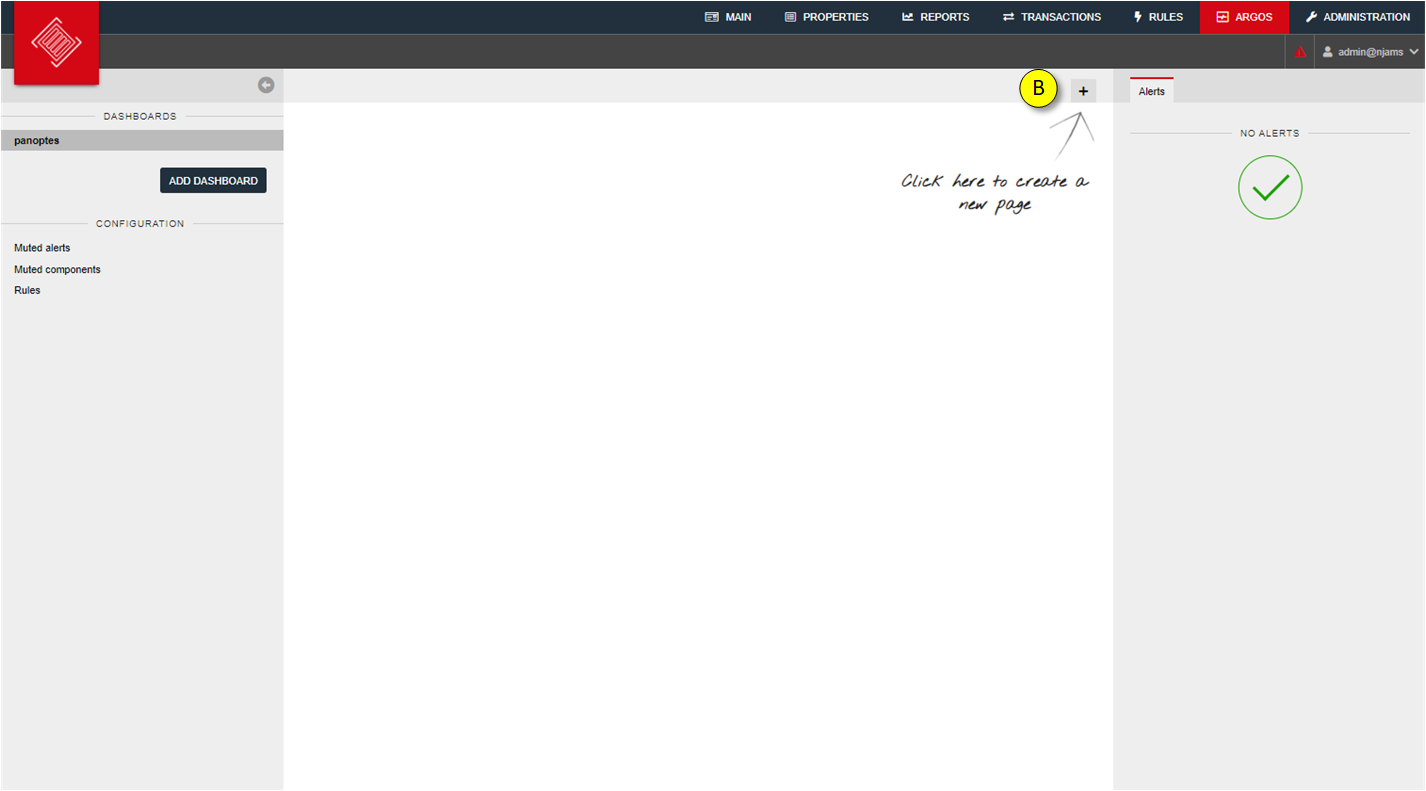
Click on
+to add a page.
- 3. Enter a name for the page:
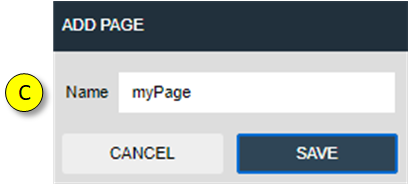
Enter a name for the page.
- 4. Switch to Edit mode:
Enter the Edit mode in order to modify the content of this page.
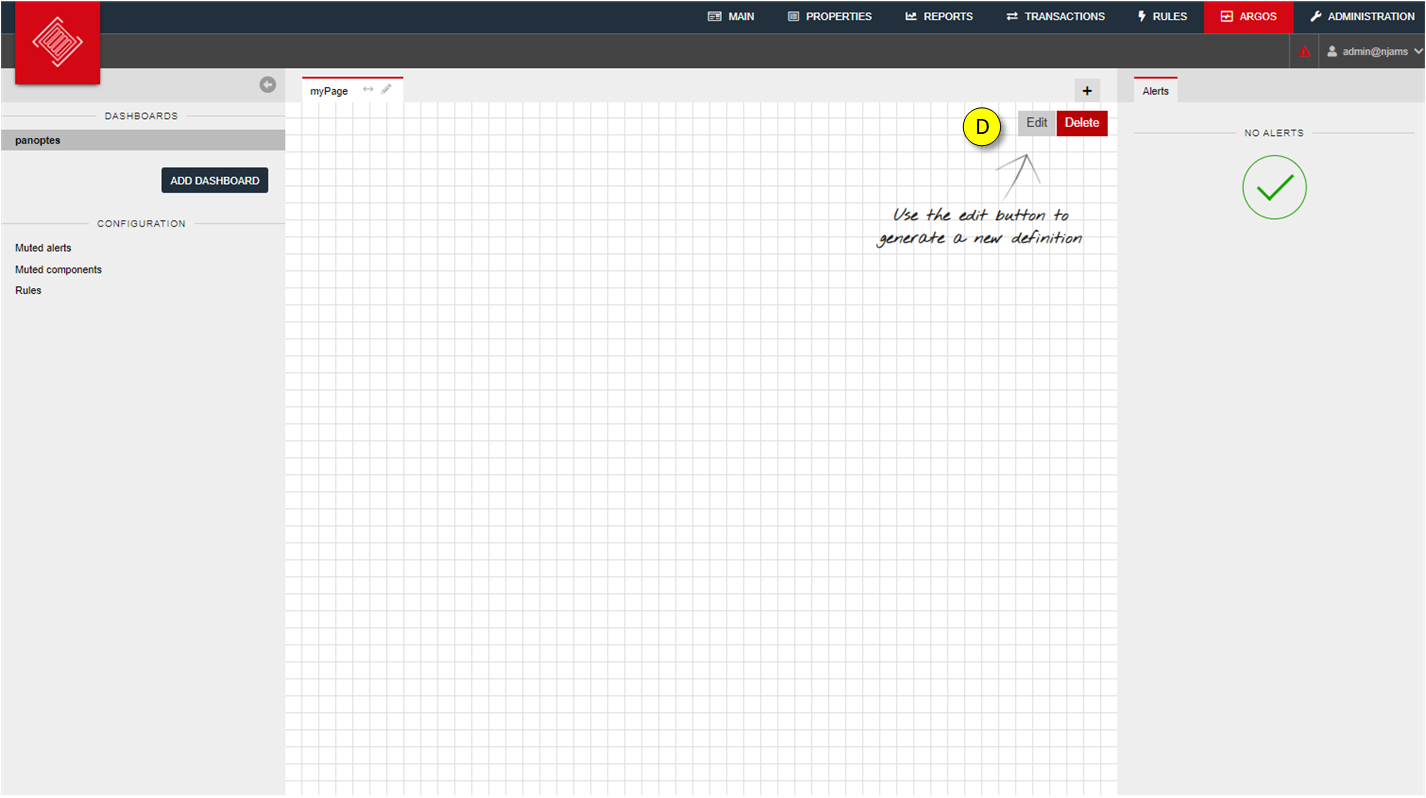
Click on
Editto enter the Edit mode. Click onDeleteto remove a page inclunding its content.
- 5. Add a component to the page:
A component represents an entity that should be under observation. For example, a component could be an application, a machine, an RDBMS, etc. A component can have a single rule or a set of rules that can indicate the status of the component or trigger alerts.
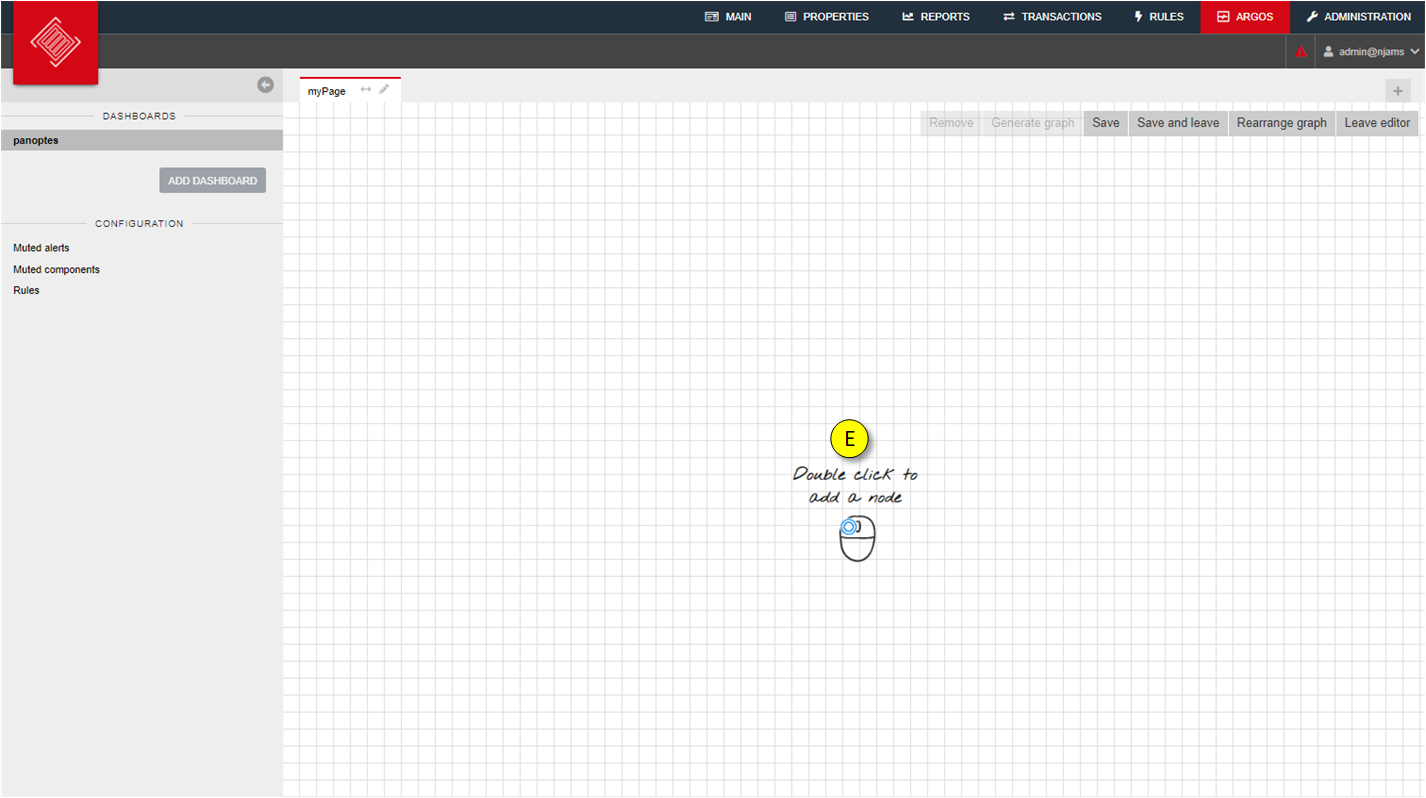
Double-click on the page to add a new component.
- 6. Configure the component:
A component can be configured in the following dialog:
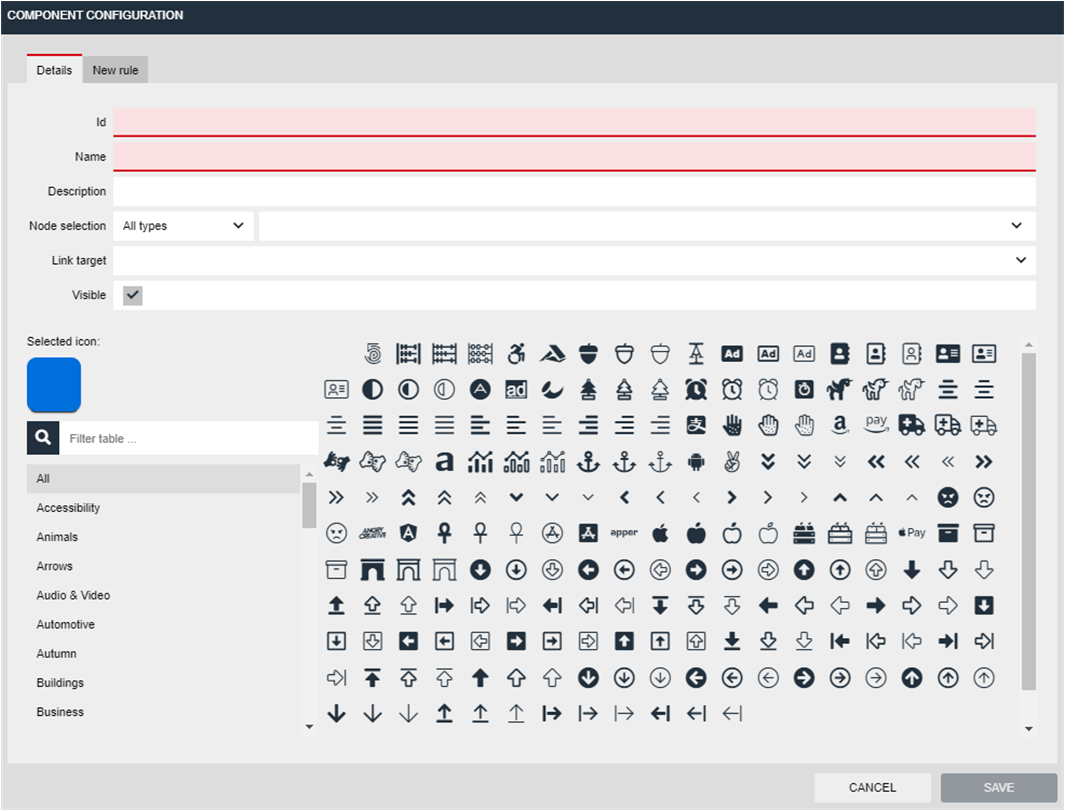
Id: Unique identifier of the component. Will be generated automatically, when a node is selected from list of nodes below.
Name: Name of the component.
Description: Take your notes here for the component.
Node selection: Select a category of available nodes. The list next to it contains available nodes of the selected category.
Link target: Add a link to a different dashboard to easily navigate from a component to a different dashboard/page.
Visible: A component is visible by default, but can be hidden, if required.
- 7. Select available categories of nodes:
In our scenario we want to observe a TIBCO BusinessWorks 6 AppNode, so we select category
tibappnode: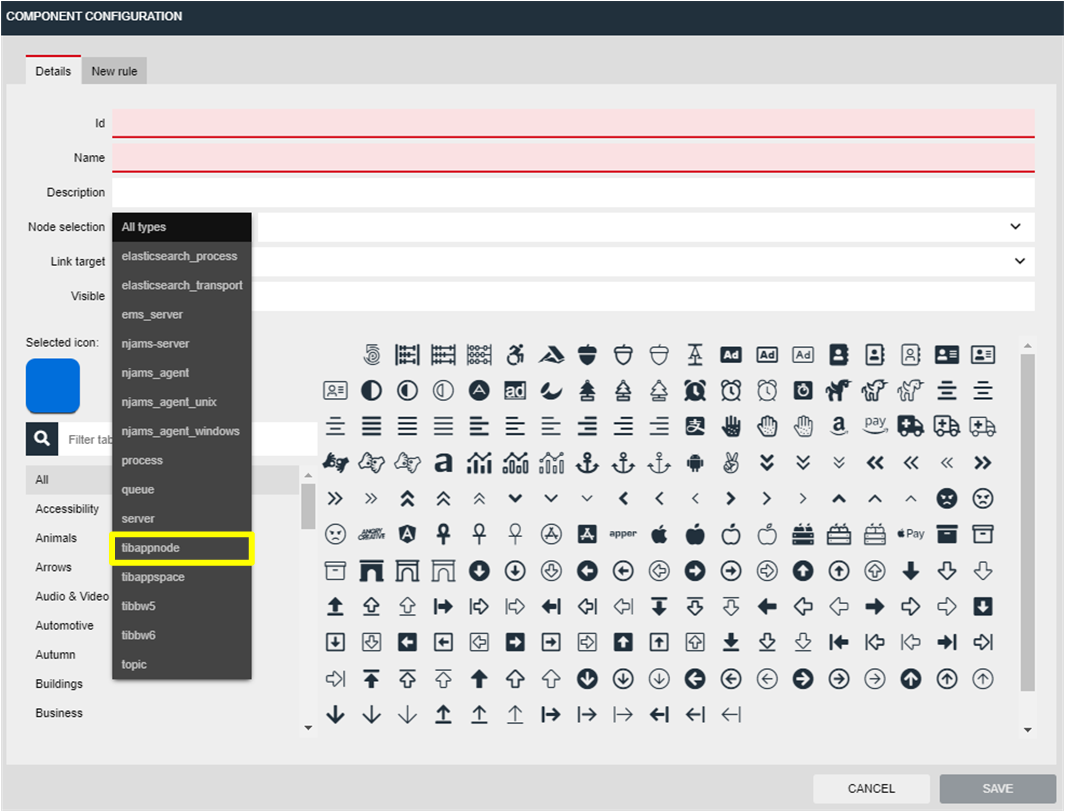
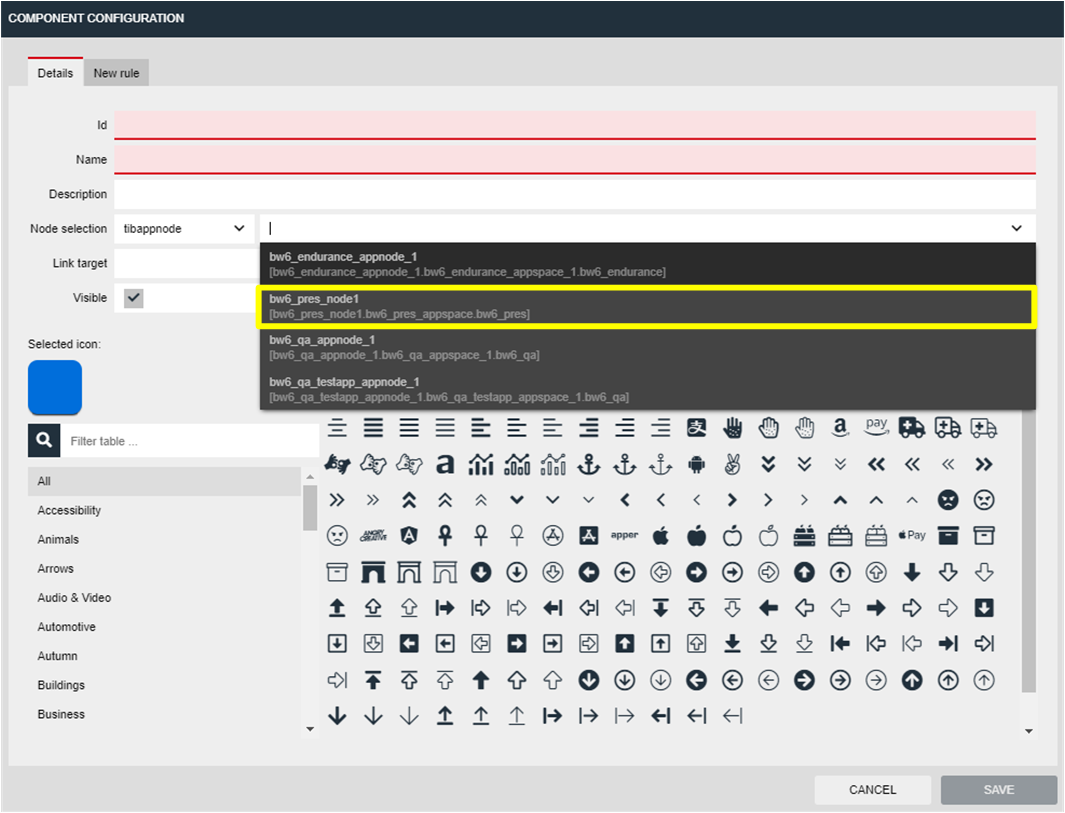
- 8. Select available nodes of a category:
The list provides available nodes in the envionment:
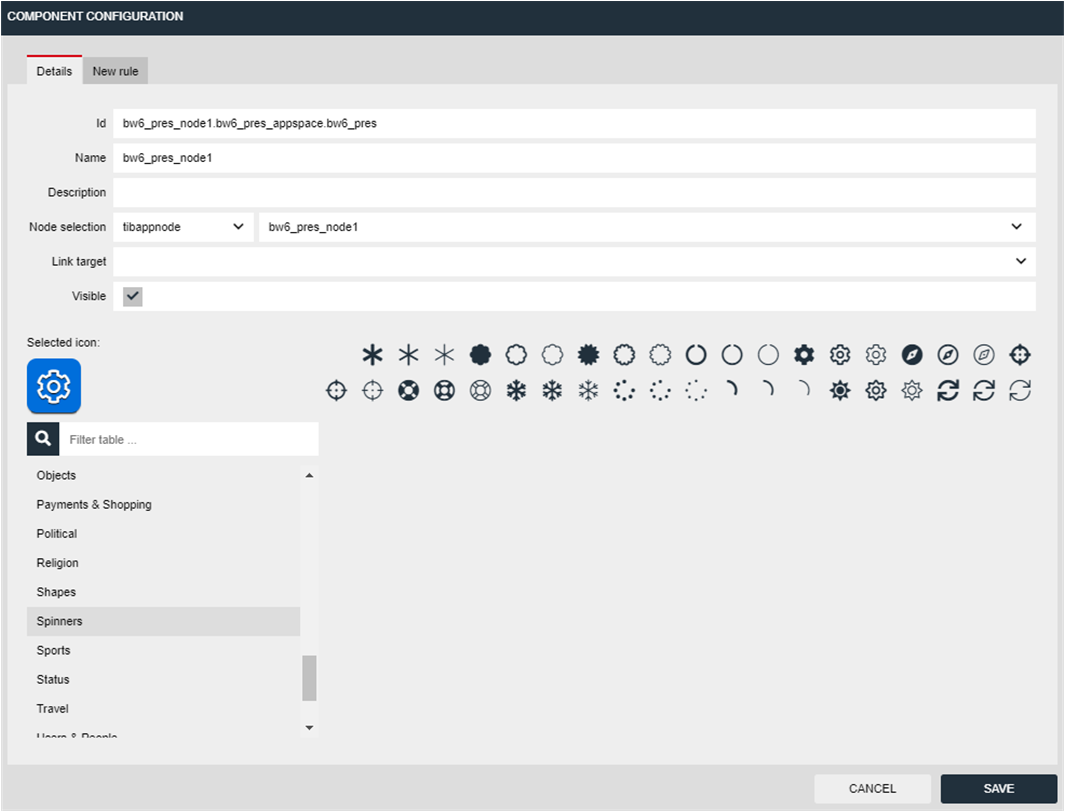
- 9. Because it’s such a joy, you can add a suitable icon for the component:
- 10. Add a rule to the component:
In our scenario we want to get notified, when the AppNode is not responding, respectively unavailable.
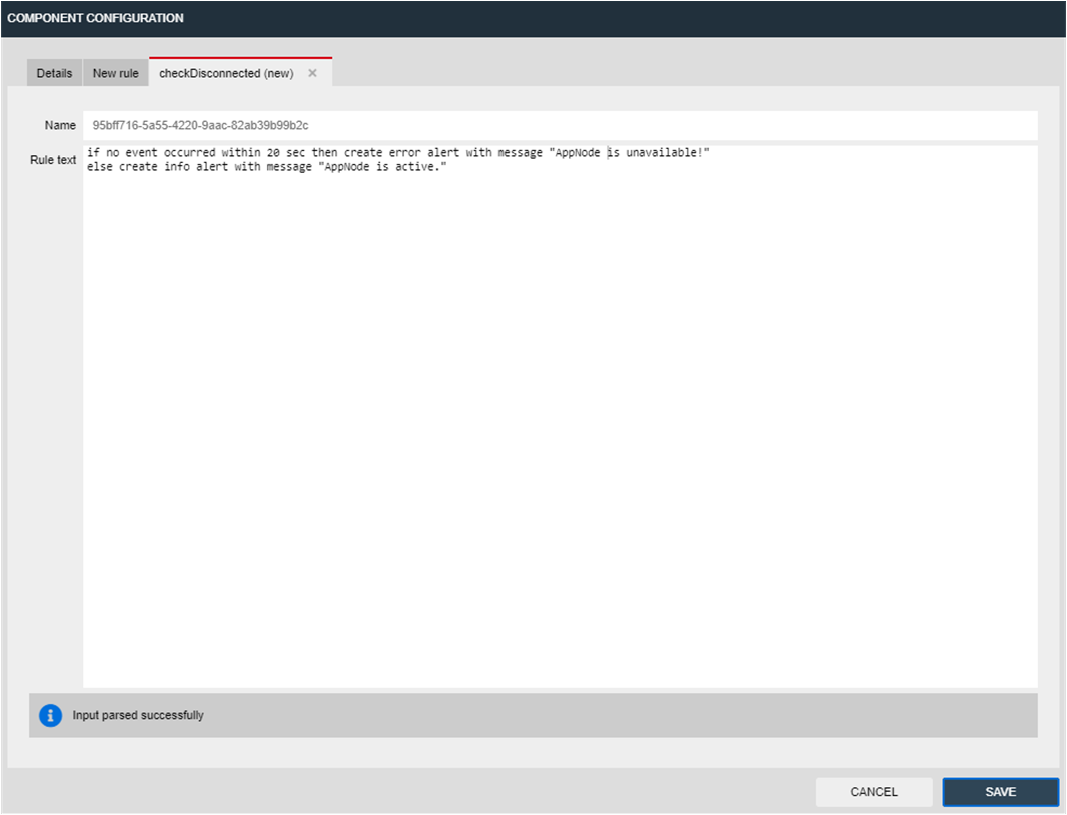
The specified rule checks for an event of the AppNode every 20 seconds:
if no event occurred within 20 sec then create error alert with message "AppNode is unavailable!"
else create info alert with message "AppNode is active."
If there is no event from the AppNode within 20 seconds, it is assumed the AppNode is inactive, respectively unavailable. In that case, an alert of type ‘Error’ is generated. Otherwise the AppNode is supposed to be active.
- 11. Save configuration of component:
Click on
SAVEto save the configuration. You will return to the page, which is still in Edit mode.- 12. Save page:
Click on
Save and leaveto save the page and leave Edit mode: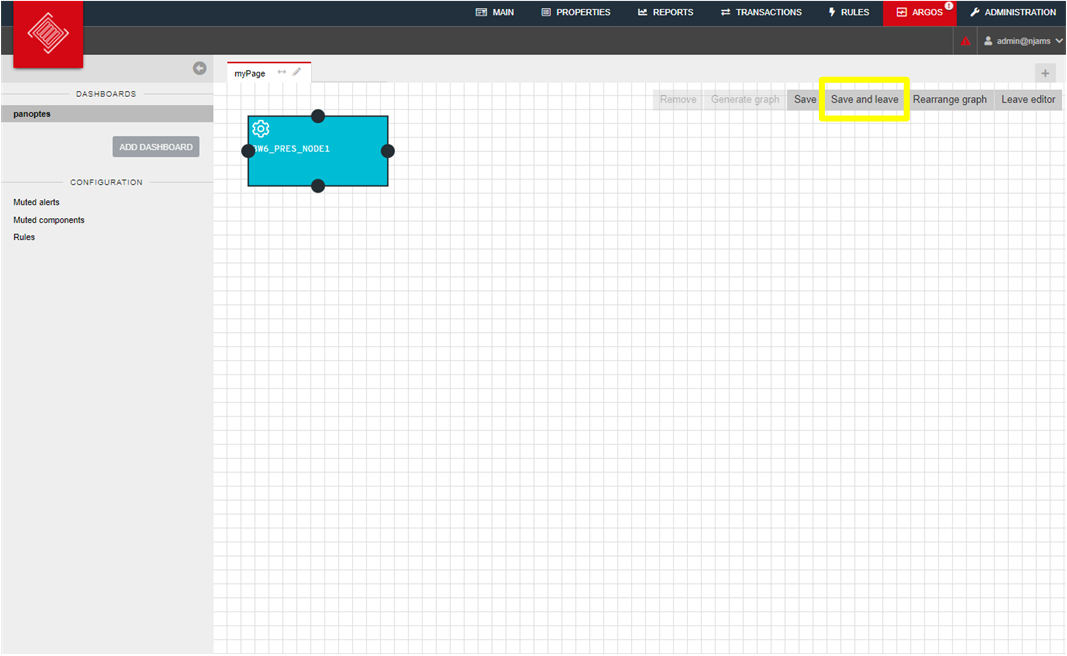
- 13. View result on dashboard:
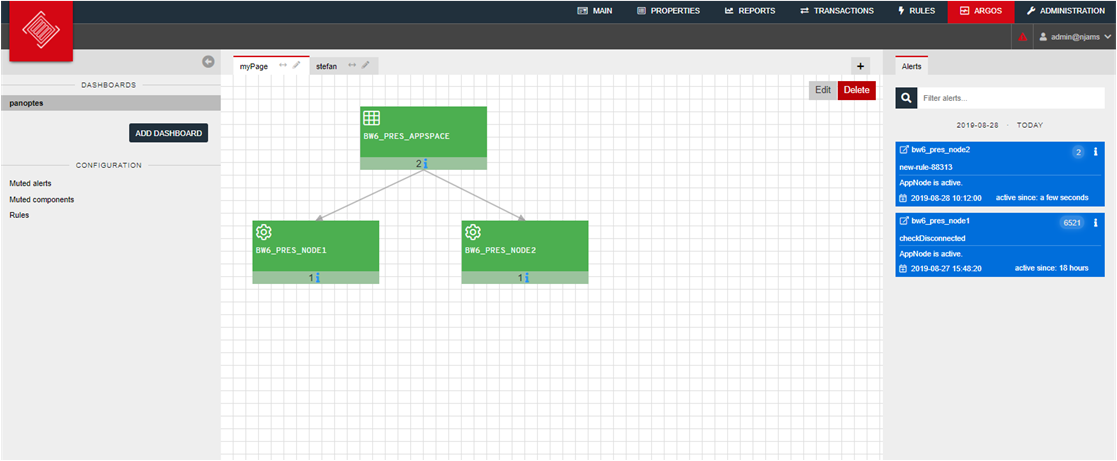
Once you left Edit mode, the dashboard becomes active and displays the component(s) and its states:
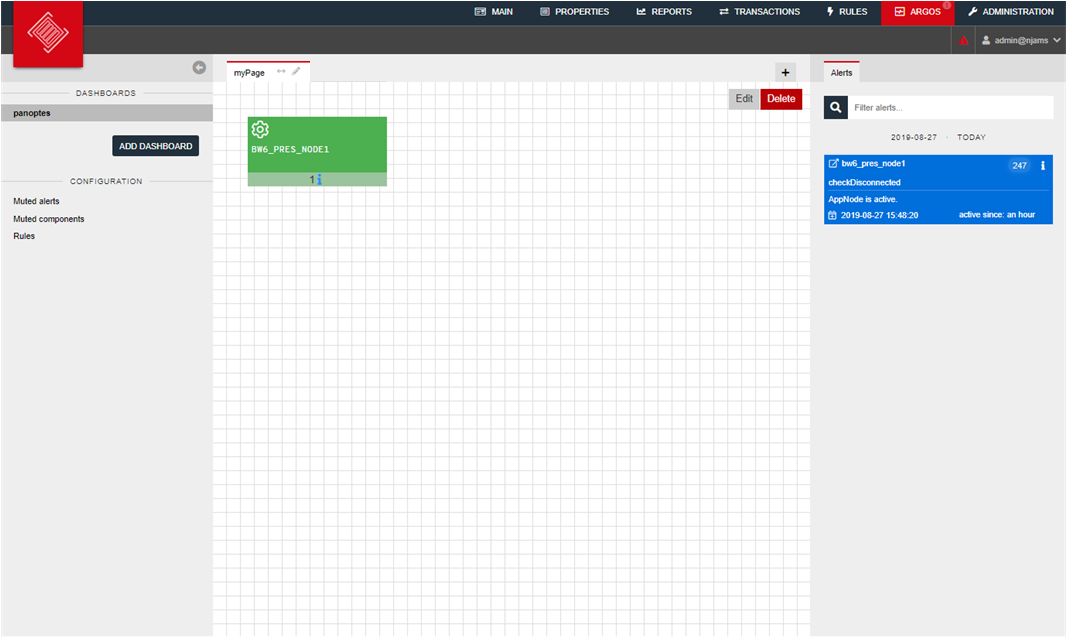
You can see the state of the AppNode is active, the tile in column ‘Alerts’ is colored blue, which indicates an alert of type ‘Info’.
As soon as the AppNode is stopped, the tile will become red, which indicates the state of the AppNode is inactive:
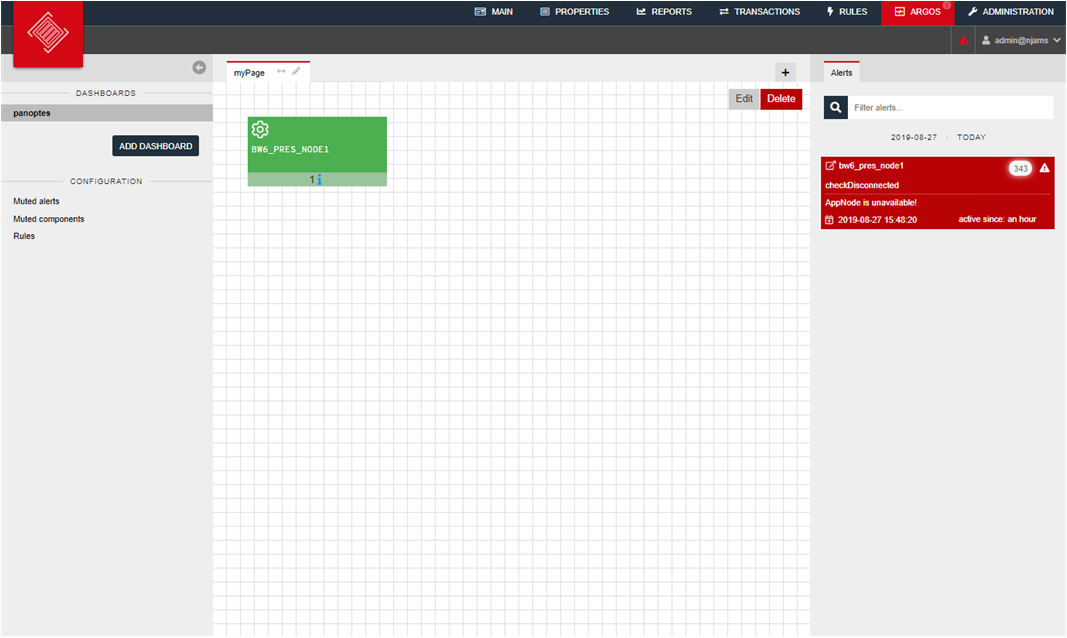
When the AppNode is responding again, Argos will recognize the availability of the AppNode and clear the error alert.
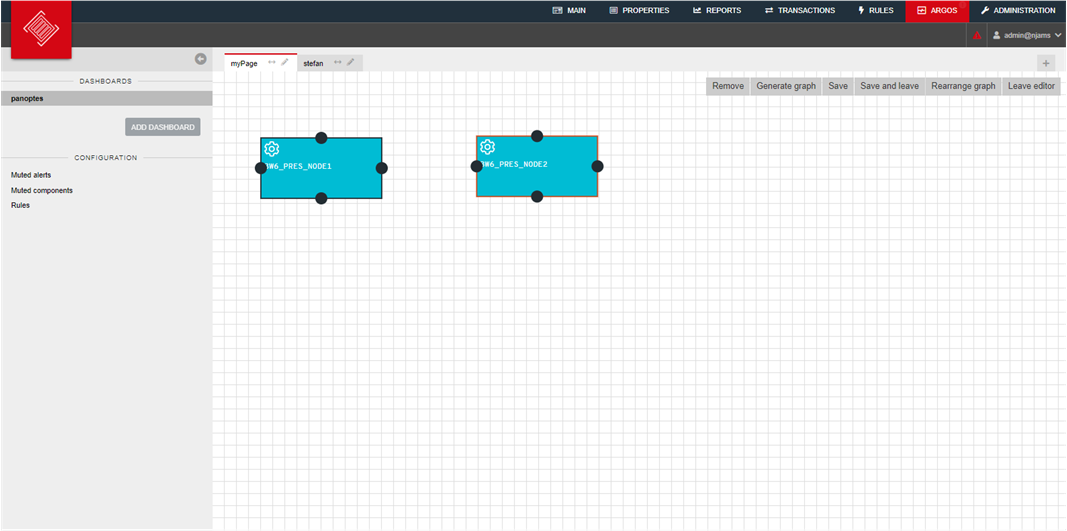
- 14. Add an additional component:
Assume you have another AppNode that should be monitored for availability as well. Add an additional component to the page based on the same rule:
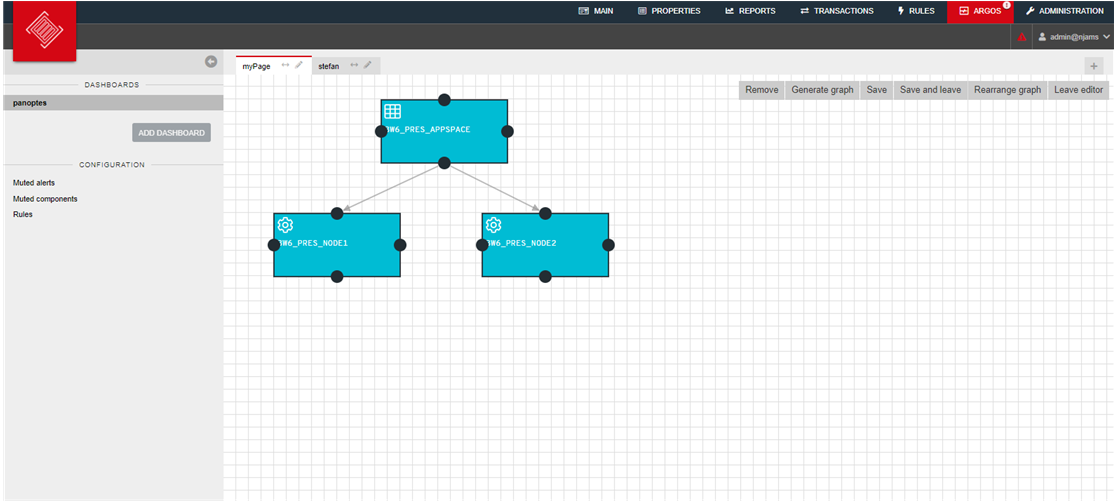
- 15. Add parent component:
In TIBCO BusinessWorks 6 AppNodes are subordinated to an AppSpace. Although an AppSpace is just an organizational unit in TIBCO BusinessWorks 6, we may want to monitor the AppSpace as well. So, the next task is to create a third component for the AppSpace as a parent component to both AppNodes.
Argos allows to define relationships between components. In our scenario we want to propagate alerts on AppNode level to AppSpace level. In case an alert occurs on any AppNode, we want to indicate the alert on the AppSpace component.
Add a third component for the AppSpace and link this component to both AppNode components:
- 16. Save and leave Edit mode and view the result on the dashboard:
There are now three components under observation of Argos. The top level component represents the AppSpace with two subordinated components for the AppNodes.
Both AppNode components are represented by a separate tile on the alert section to the right:
See what happens, when AppNode 2 is unavailable:
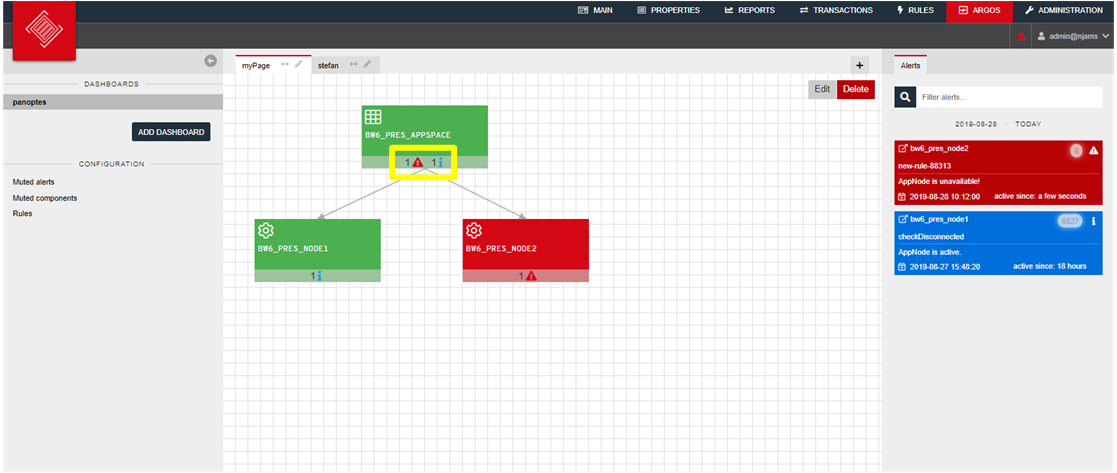
As expected, an alert is displayed on the tile for AppNode 2. On the parent component, the AppSpace, you can see an alert icon that indicates a disfunction of the AppSpace itself, respectively of the linked AppNode components. The alert of AppNode 2 has been propagated to the AppSpace.
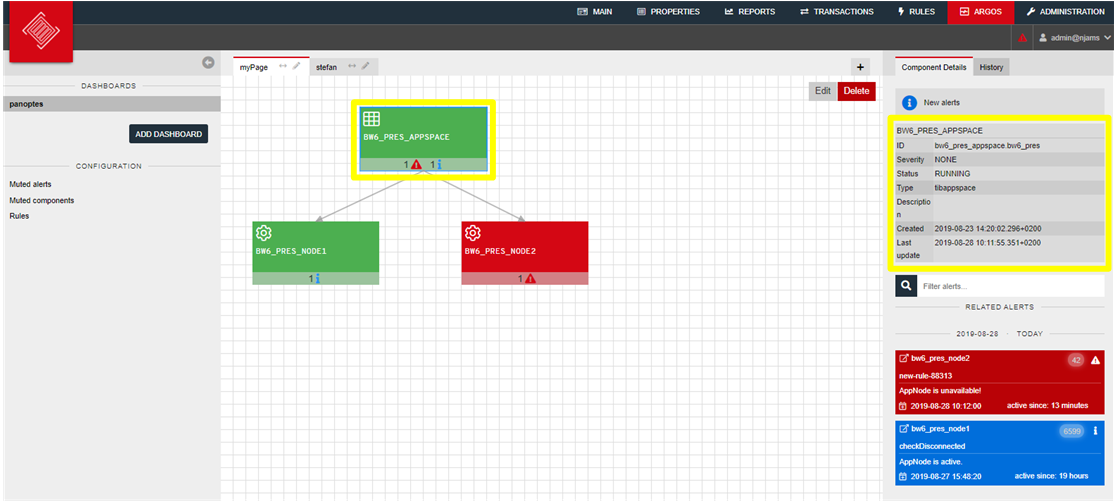
In case of an alert, you may want to see more information of the disturbed component. Click on a compontent to get more details:
Based on this short introduction you should now be able to start creating your own dashboards with Argos.