Overview of nJAMS User Interface#
Main View#
Main View is the central page for working with nJAMS. It is the main page where the user can search for monitoring events and examine the results.
The Main View consists of the following sections:
- Title section:
The Title section represents the main navigation of nJAMS GUI. It is visible on all pages, you can navigate to the top level sections from any page you are.
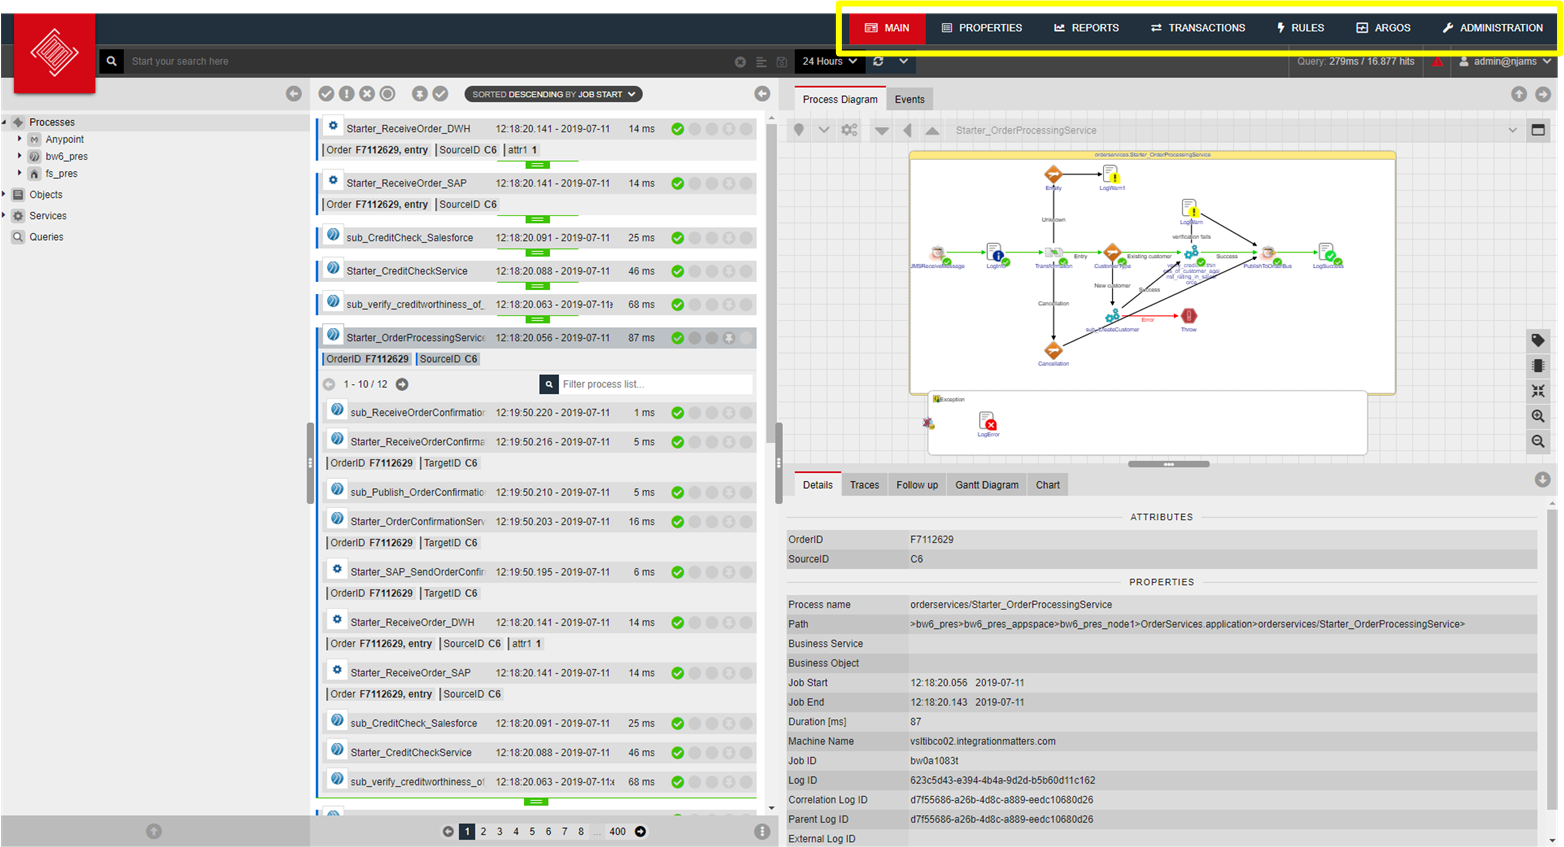
The top level sections are:
Main - search for monitoring events and examine results
Properties - configuration of nJAMS Clients and nJAMS’ monitoring objects
Reports - predefined and custom Report page
Rules - define rule based actions
Argos - dashboard for Application and Infrastructure monitoring
Administration - the page for administration and configuration of nJAMS Server
Notifications - indicates notifications
User menu - allows user logout and configuration of user profile
- Query section:
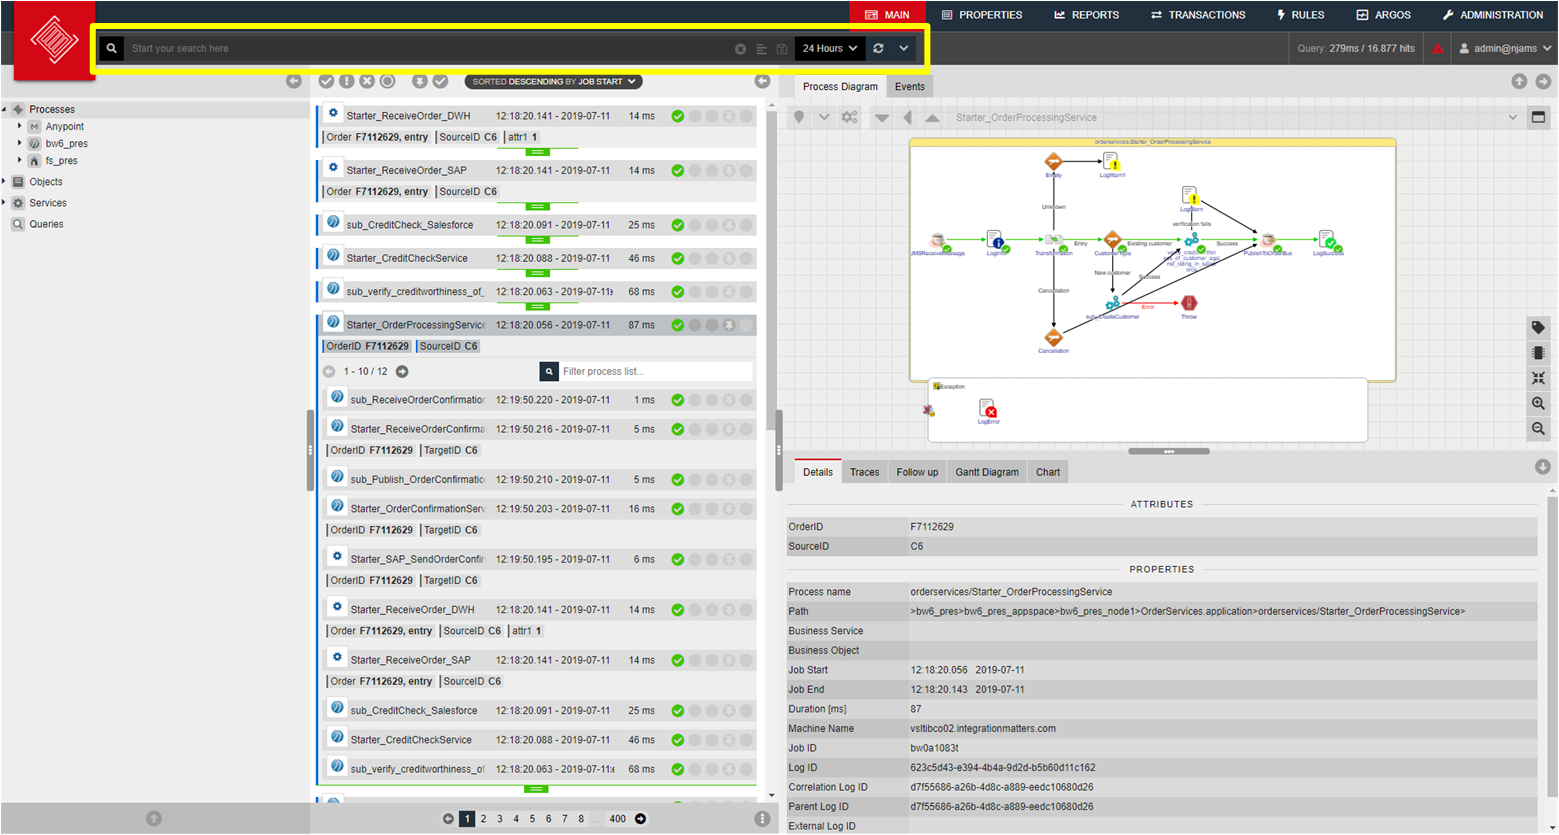
The Query section consists of the following elements:
Query line - Enter your search term or query here. Pressing RETURN executes the query and returns with the result set of monitoring events.
Query status - beneath the Query line you can see the return status of the execution of the query.
Time selector - the Time selector specifies the time frame of all searches. In this example all searches are limited to monitoring events of the last 7 days.
Update - the update button executes a search on demand. Press this button, when you want to have a current result list.
- Navigation tree:
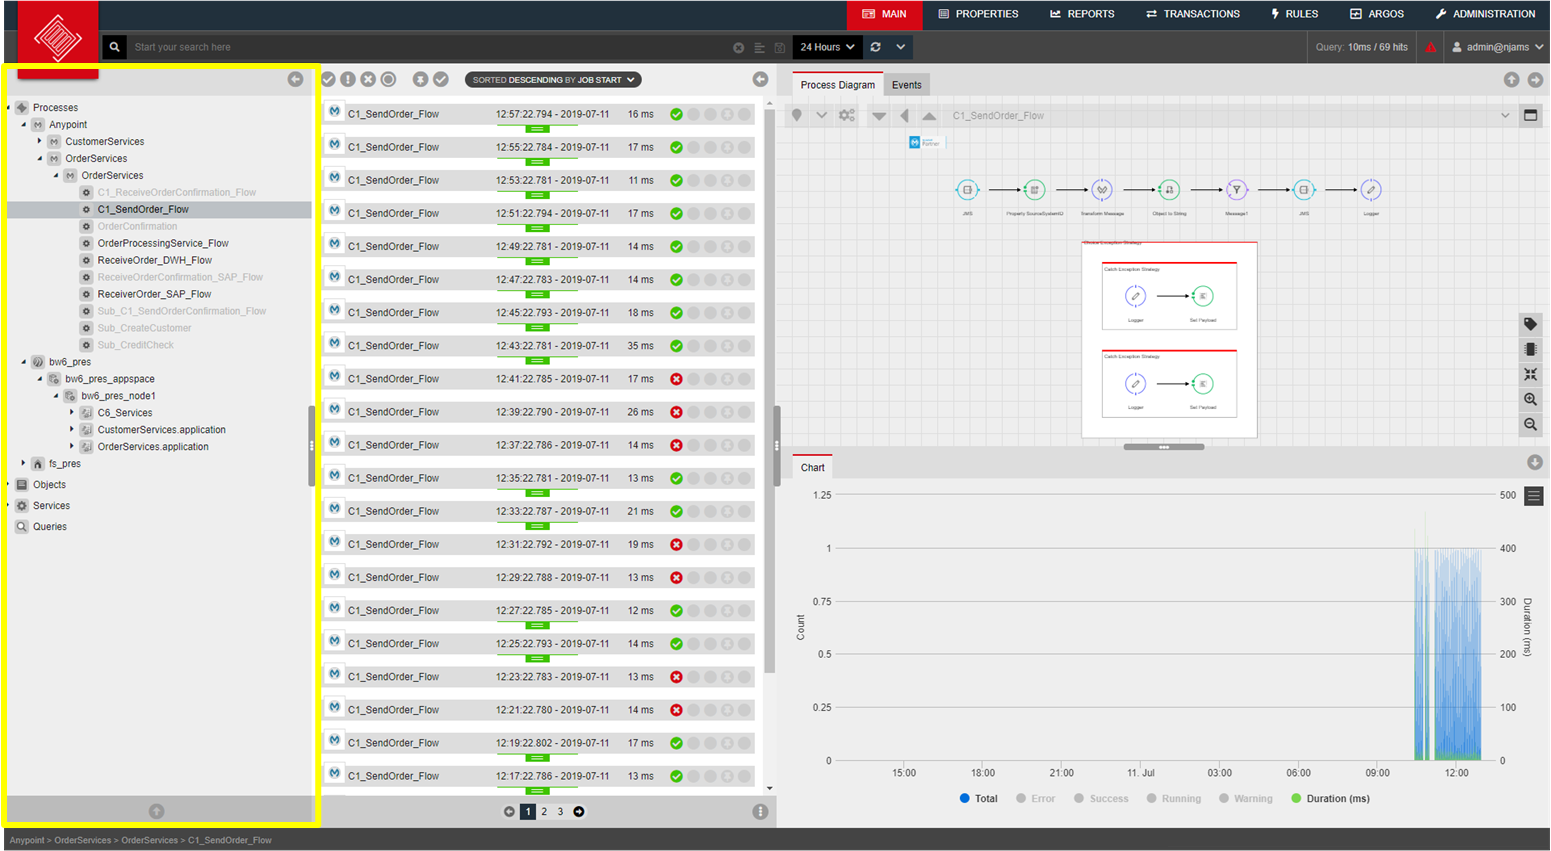
The Navigation tree allows you to browse the monitored objects. There are four categories of objects currently available:
Processes - this is the hierarchical structure of the monitored technical processes
Services - Business Services provide a meta layer where technical processes can be assigned to functional services
Objects - Business Objects characterizes the transported data from a functional perspective.
Queries - User defined Queries can be selected from this category.
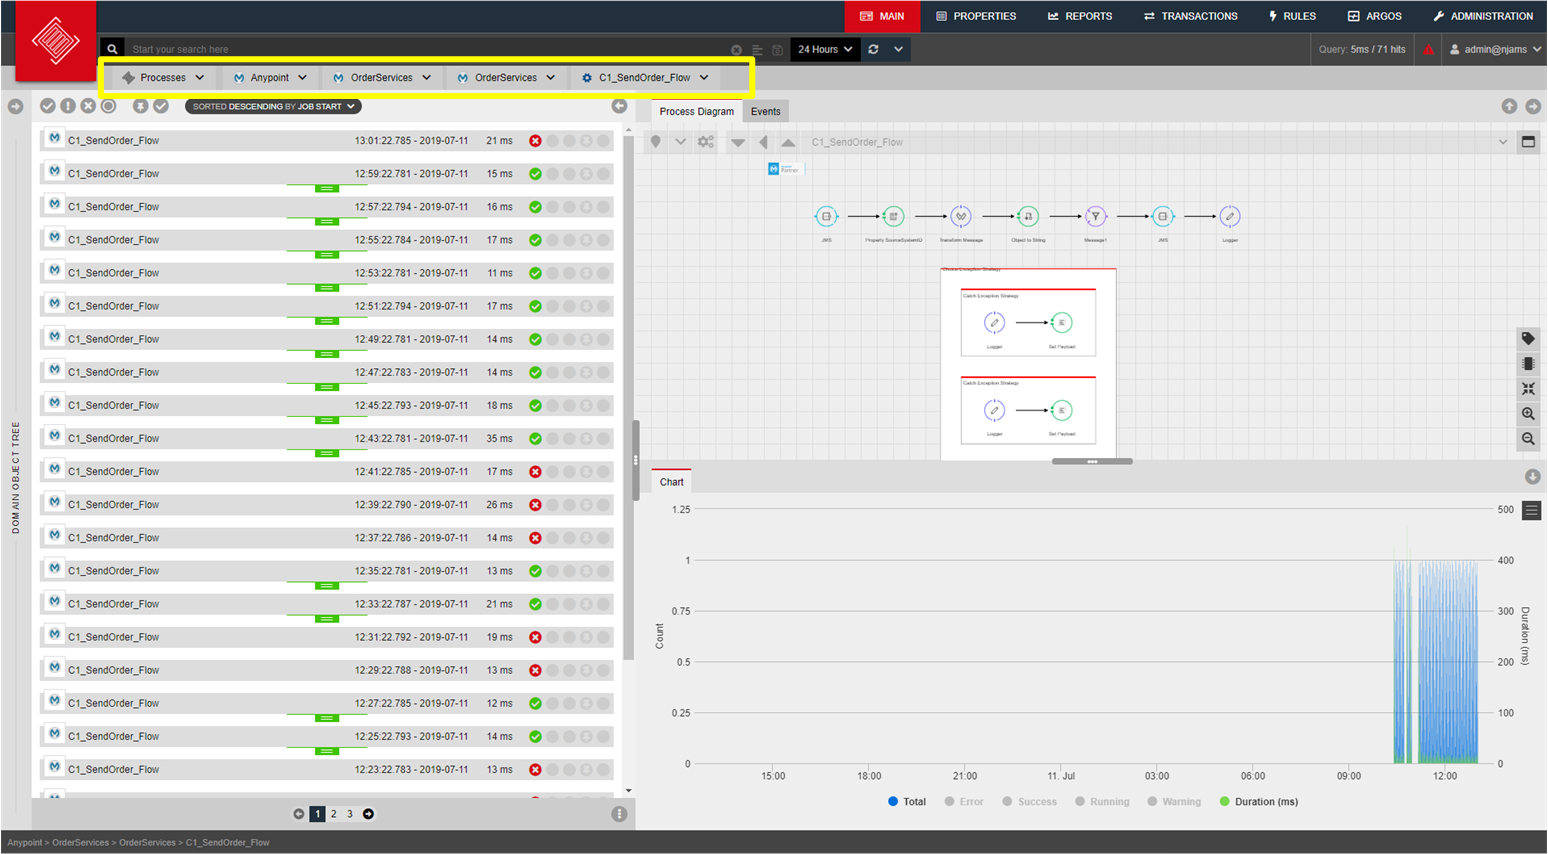
The Navigation tree can be arranged vertically or horizontally.
In this example the Navigation tree is arranged horizontally, which provides more space for Result list and process diagram:
- Result list:
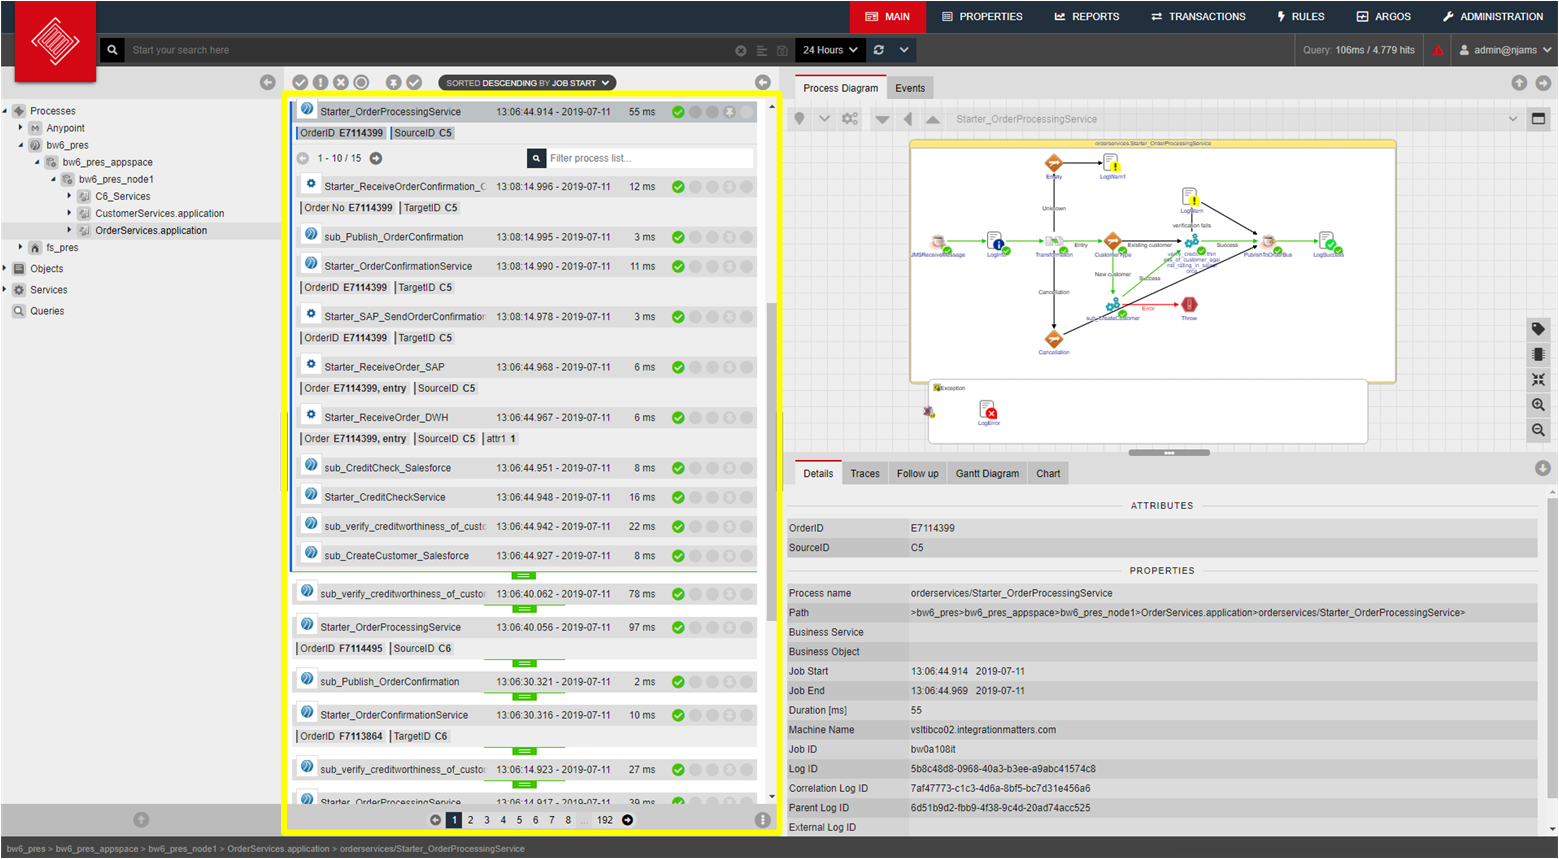
The Result list contains monitoring event entries with regards to the current search criteria. Each entry represents a monitoring event of one single process execution. The Result list provides the status of the process execution, the process name, the start time, and the execution time.
- Process diagram:
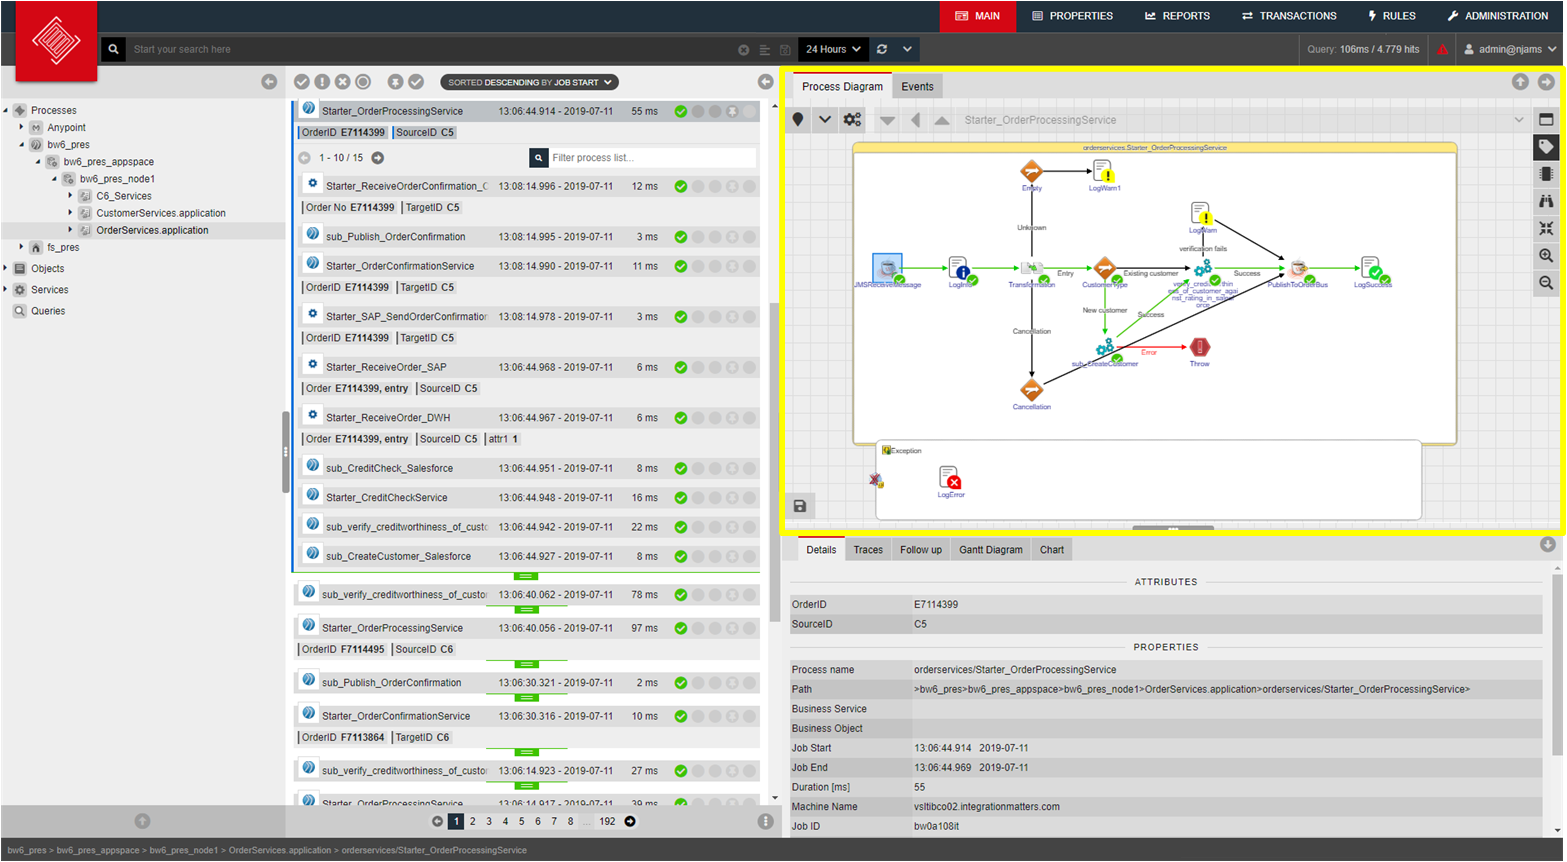
Based on the selection of the Result list, the process diagram is displayed for a particular process execution. Based on the selection of the Navigation Tree, the process diagram represents the current process definition. A process definition is the process model the developer created. Over time, processes can change. When you select a process from the Navigation Tree, the process diagram always shows the latest process definition. When you select an entry from the Result list, the process diagram always shows the state of the process model at the time of the process execution.
- Details section:
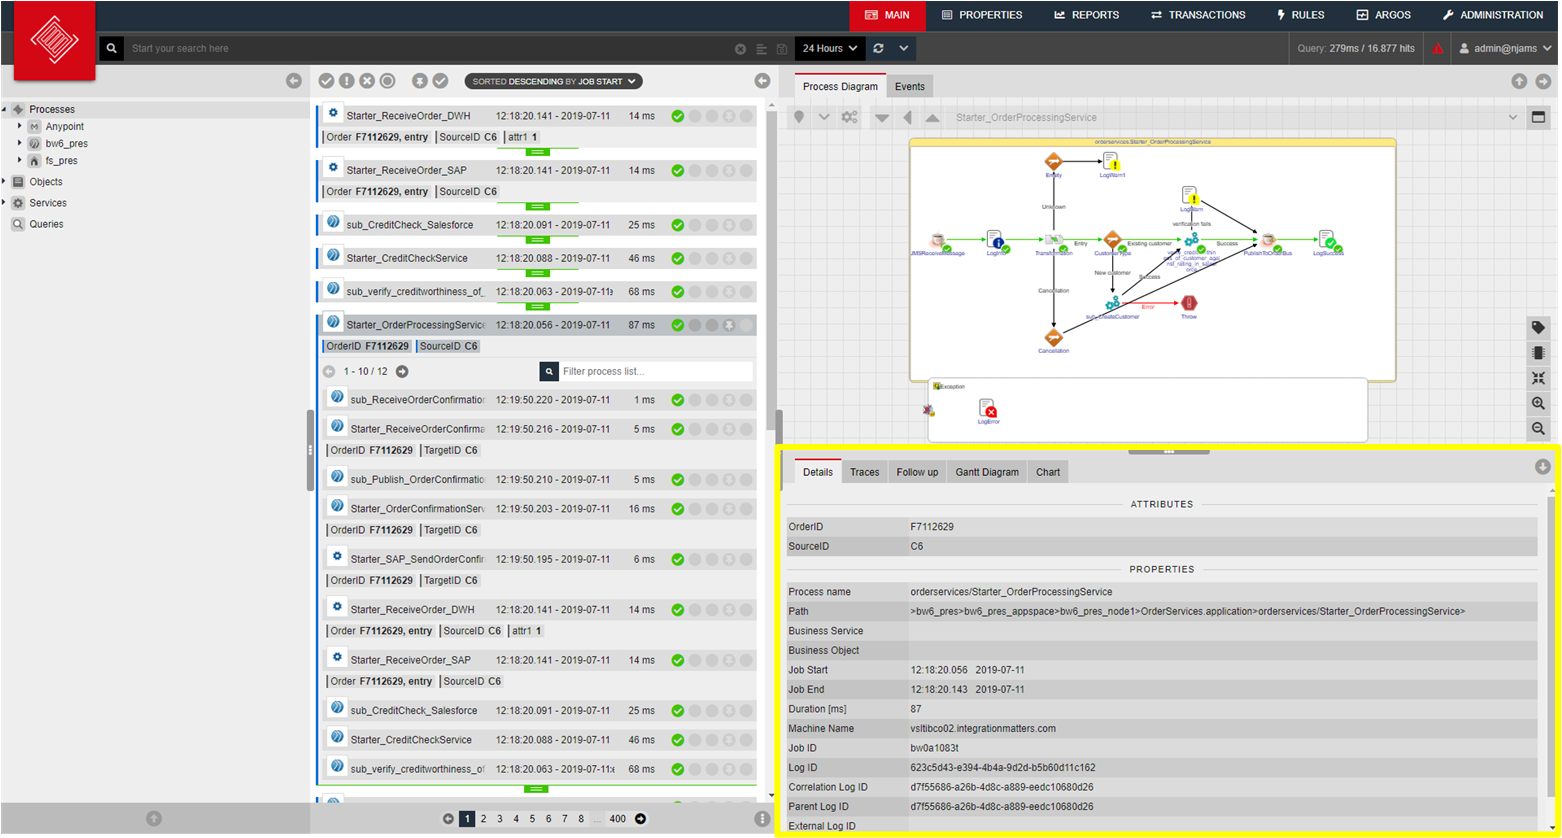
The Details section is dependent on the current selection. If an entry from the Result list is selected, you can examine details for this certain process execution. If you select an activity from the process diagram, you can see related information to this particular activity
- Context section:
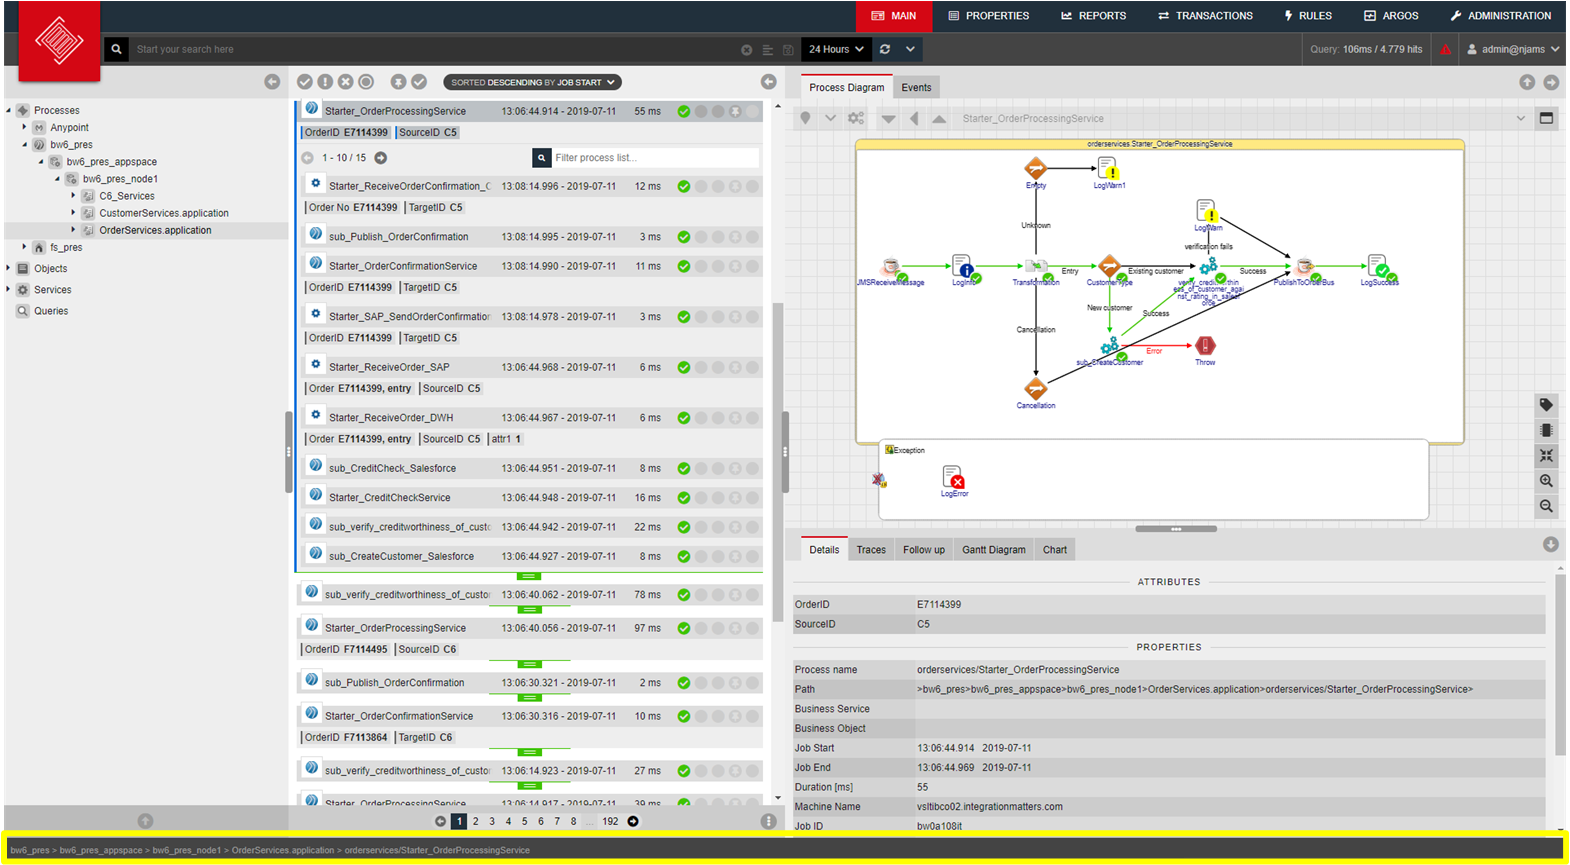
The Context section provides context information related to the selection of the Result list. Select a Result list entry and you can see the deployment path of the monitored process.
Properties#
The Properties page lets you configure the settings of Processes and Queries. Depending on the selected object from Navigation tree you can specify individual properties such as data retention, log mode, log level, etc.
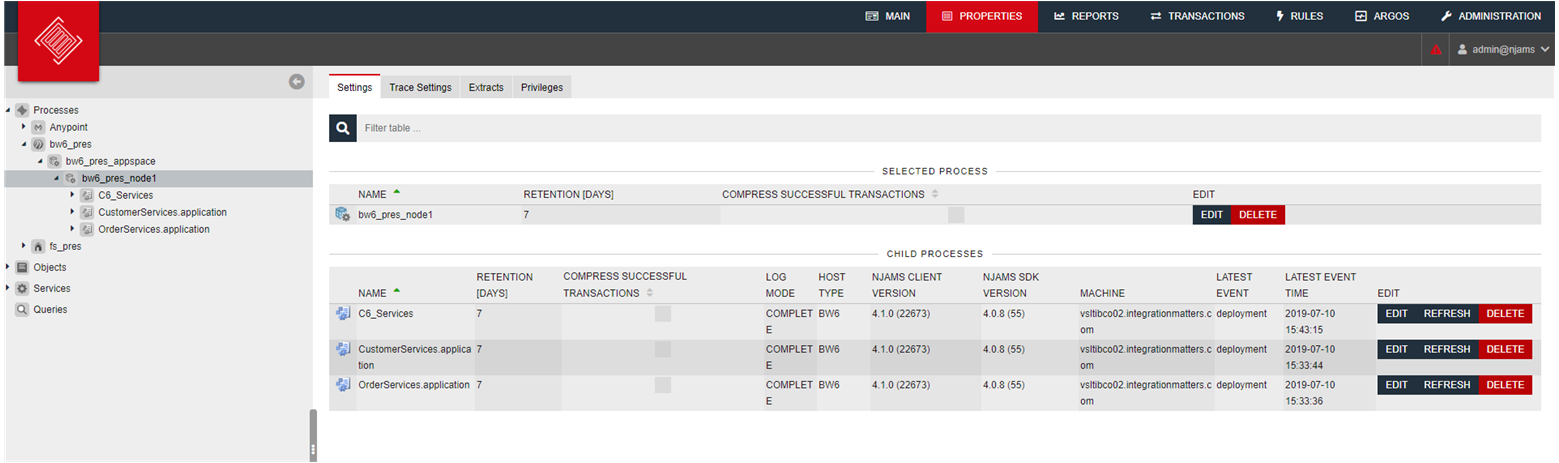
Furthermore you can edit Trace points and Extracts with regards to the selected object. And you can assign permissions to any object.
Note
Properties can only be edited by authorized users. For example, WRITE privilege is needed to edit Trace points or Extracts.
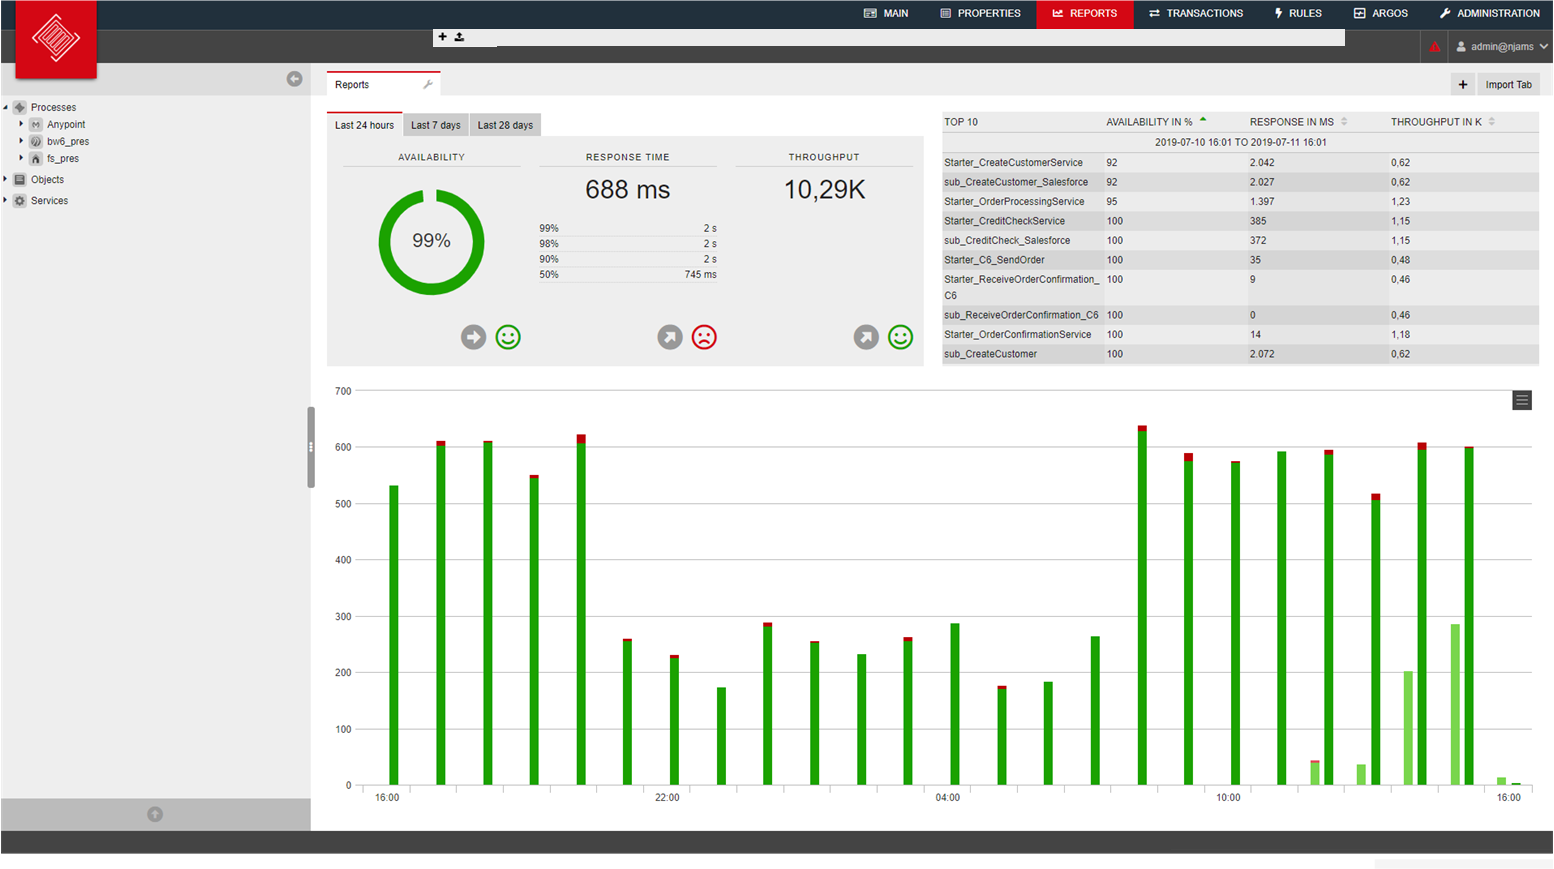
Reports#
The Reports page provides a live process performance dashboard. The pre-defined dashboard shows availability, response time and throughput of end-to-end business processes for a certain period of time. You can also create your own custom dashboards.
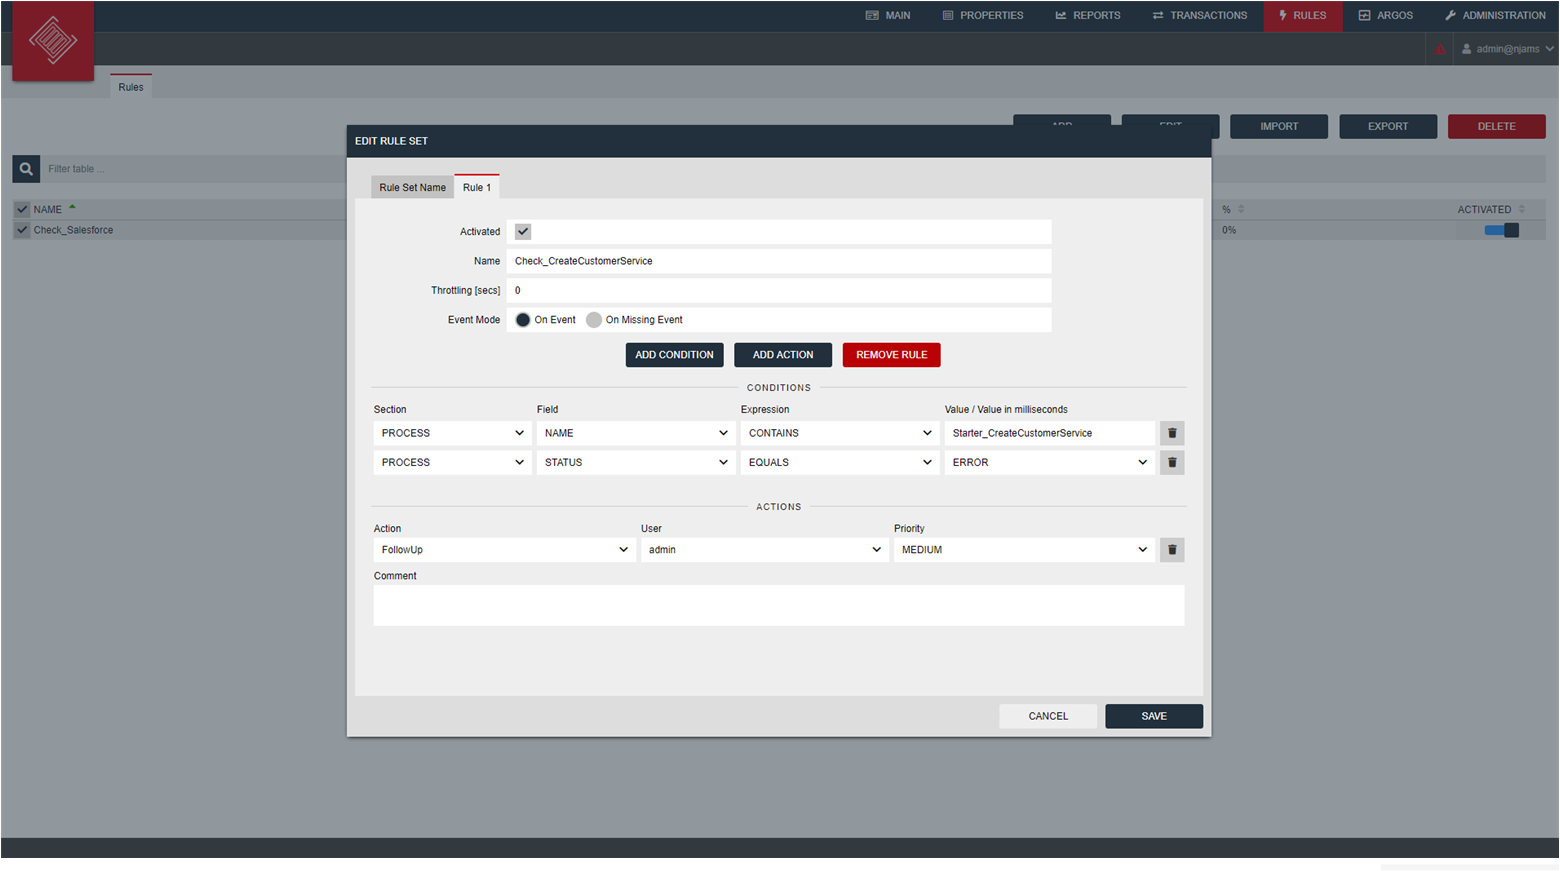
Rules#
On the Rules page you can define rule based actions that trigger alerts in case of Errors, for example.
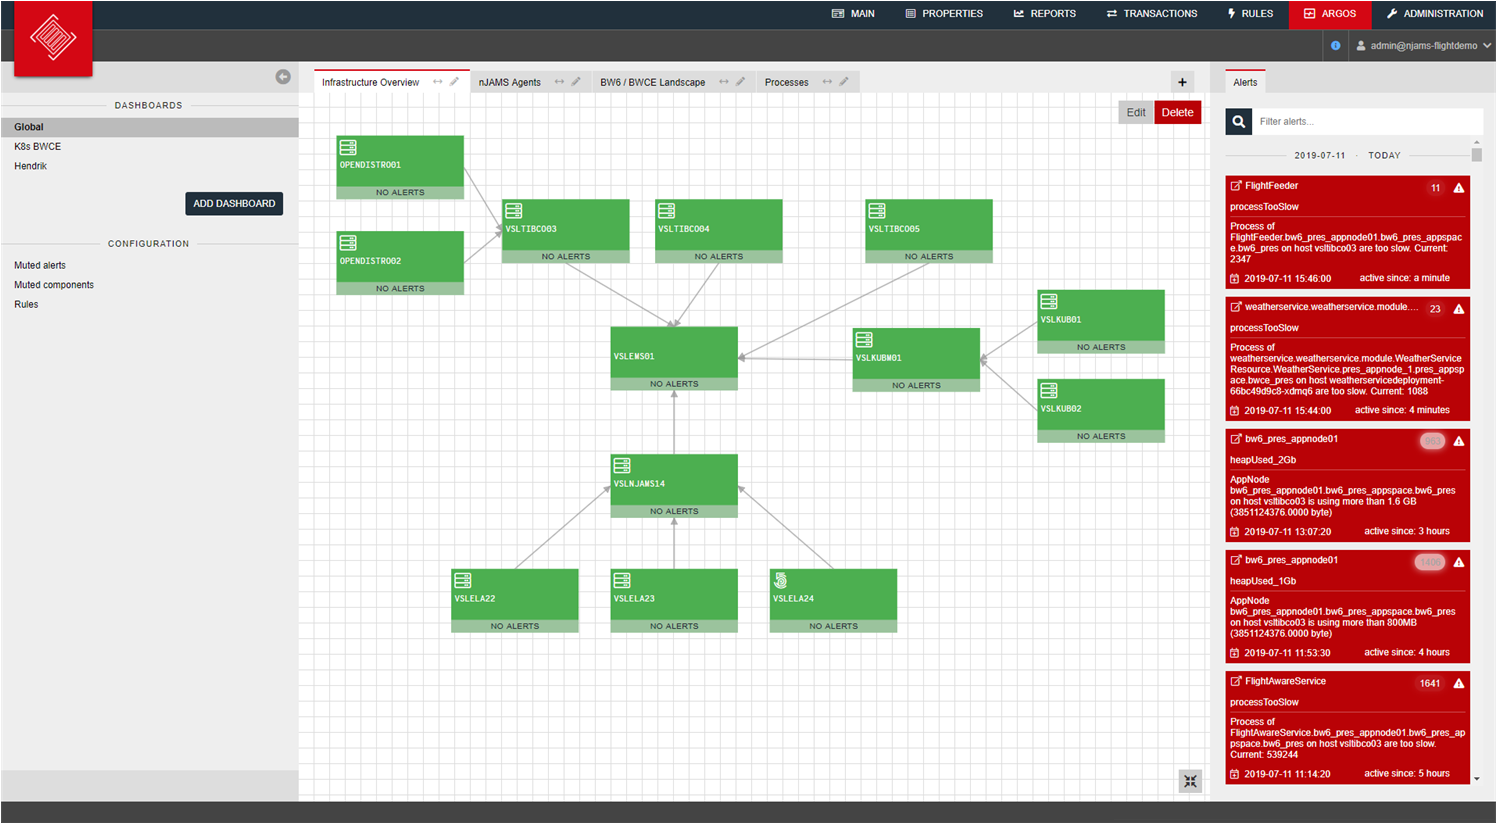
Argos#
The Monitoring page provides visibility of applications and infrastructure. Please refer to nJAMS Argos manual for a detailed description.
Administration#
The Administration page allows you to configure and administer nJAMS Server. Please refer to nJAMS Server Administration Guide for a detailed description.
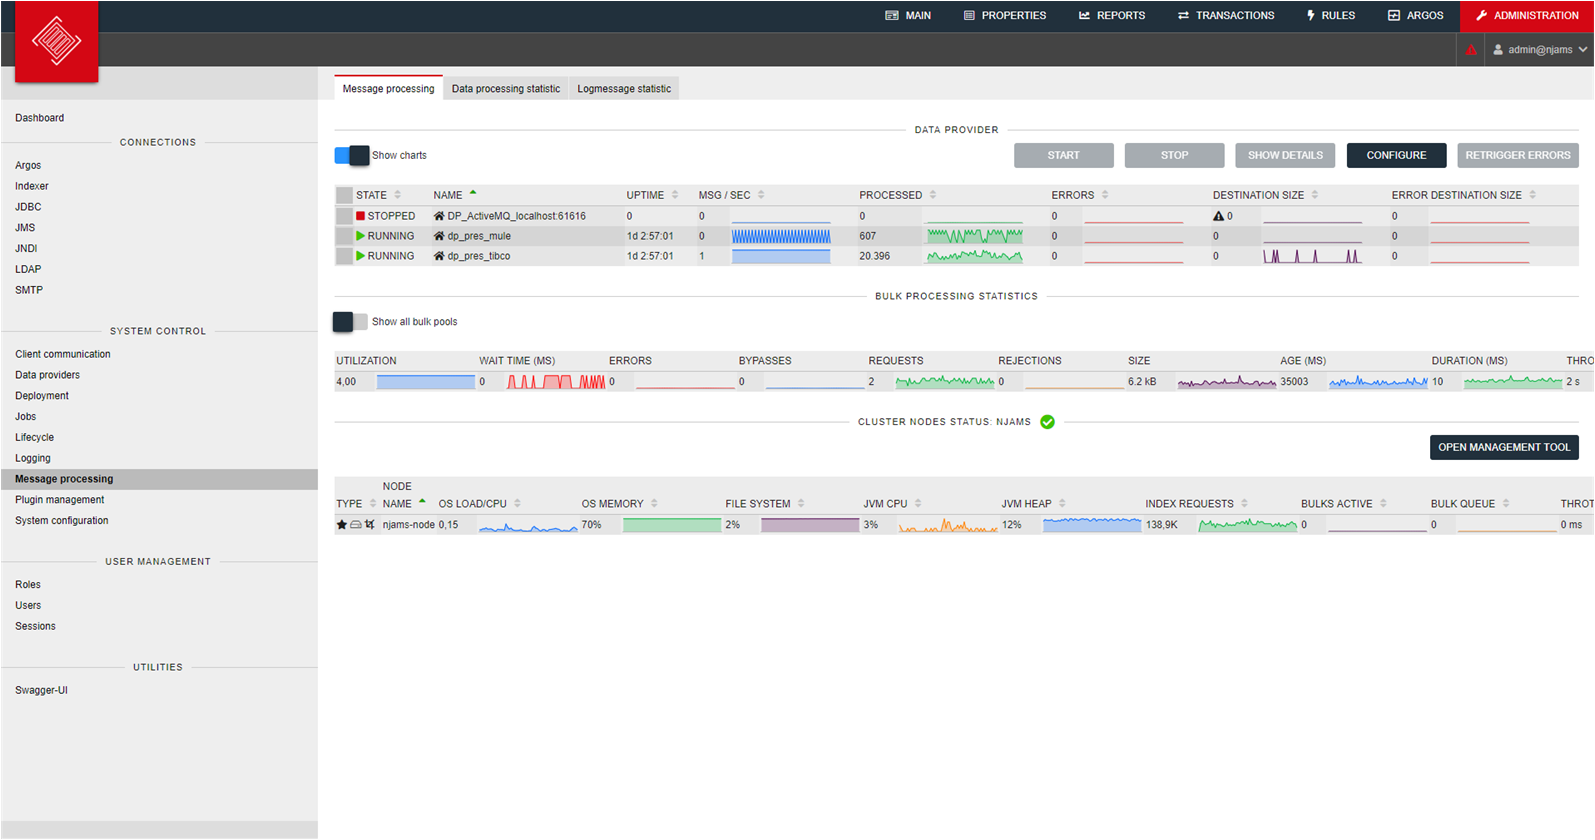
Note
The Administration page is only available for nJAMS Administrators and nJAMS Server Operators.