Working with Argos#
Composite#
Use a composite to combine several components to one aggregated element. For example, you already have a dashboard that contains components of nodes of an Elasticsearch cluster. Each component represents the state of an Elasticsearch node:
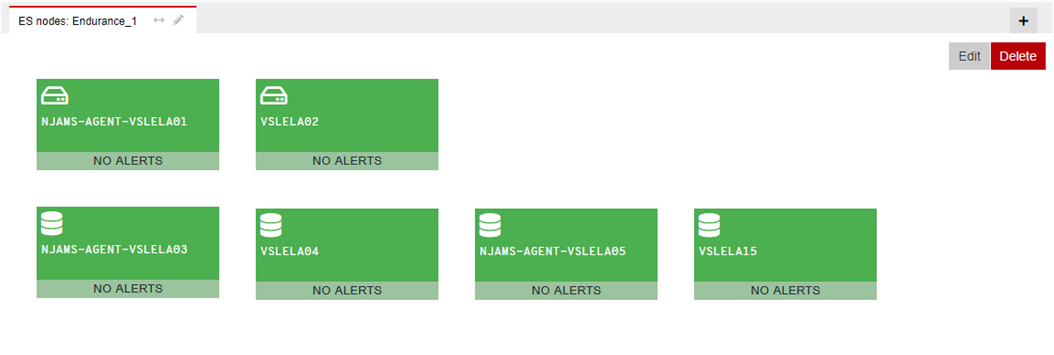
For just getting a short overview of the entire cluster without interest in the particular nodes, you may want to have a composite that represents the combined state of all nodes, respectively the state of the entire Elasticsearch cluster.
Procede as follow:
Add a new page “Overview” and save it.
Edit the page and add a new component:
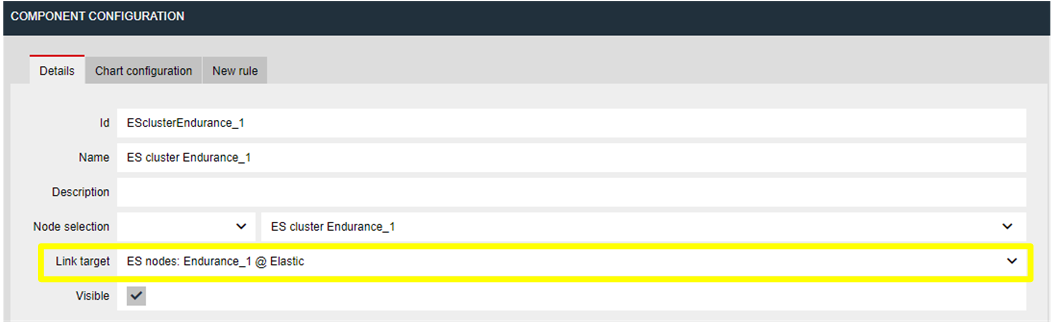
Enter a unique id and a name
At Link target select the page of the Elasticsearch cluster from the list
Save component configuration
Save page and leave editor
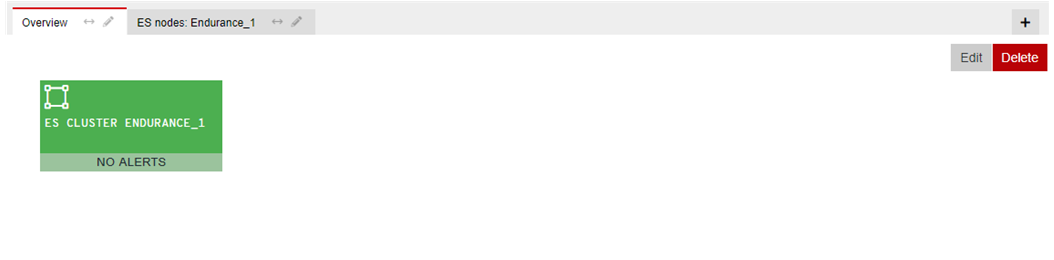
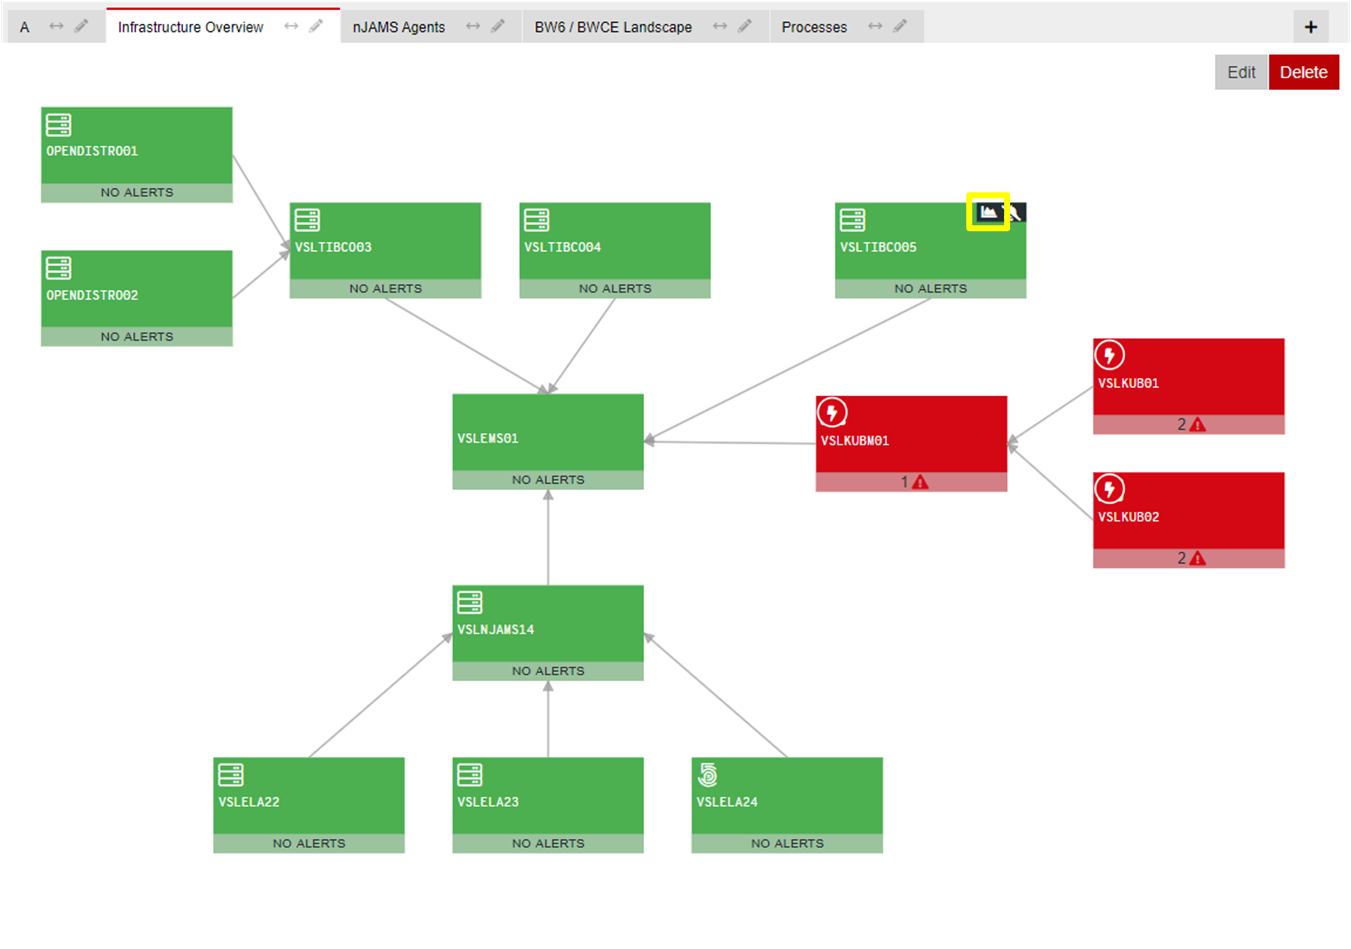
You now have a new page containing a composite that represents the entire cluster state:
When you hover over the composite element, you can click on several icons:
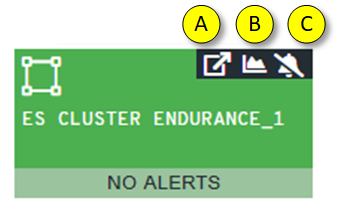
Jump to linked page of the composite
See statistics graph, if available for the composite
Mute alerts of the composite
Stats graph#
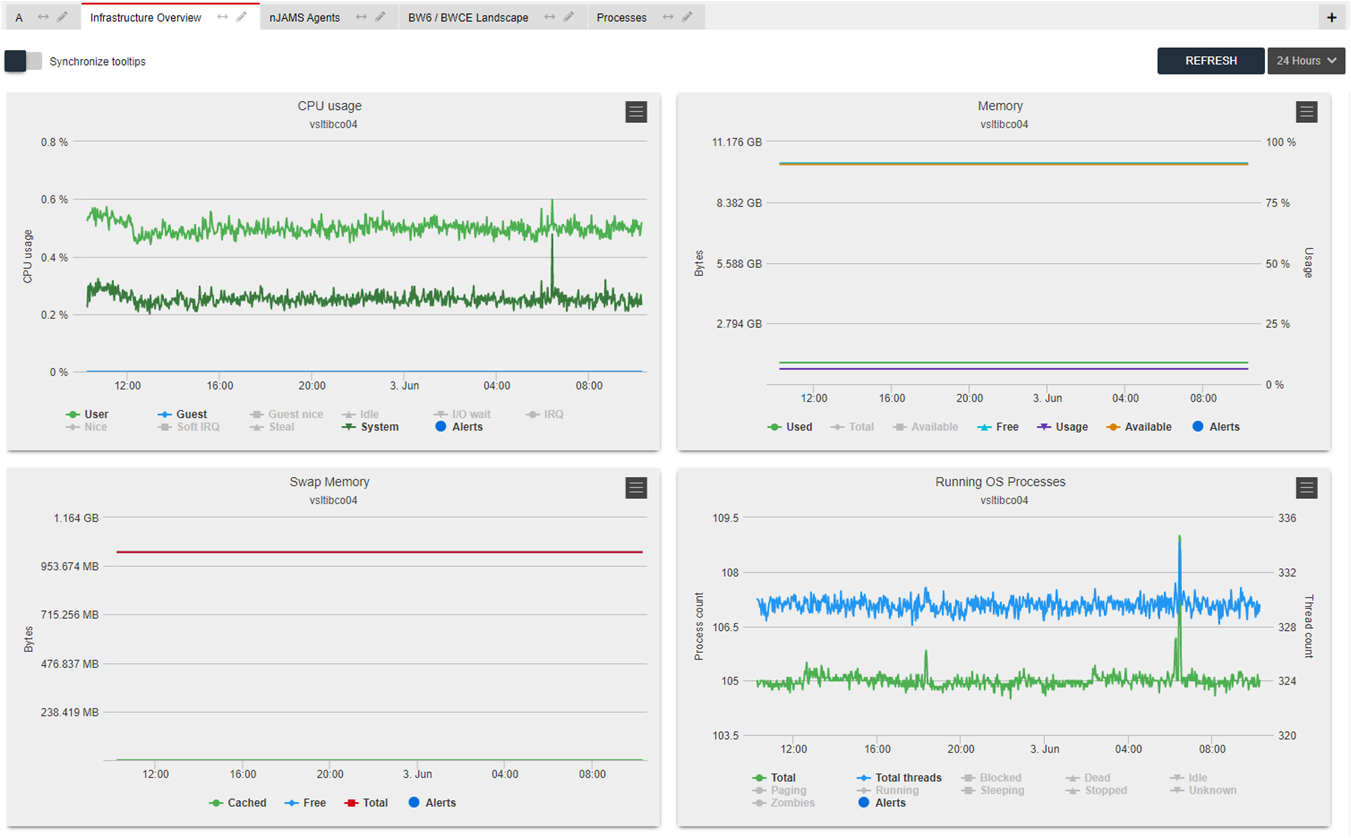
Depending on the component, you can inspect the statistics graph by clicking on the charts icon:
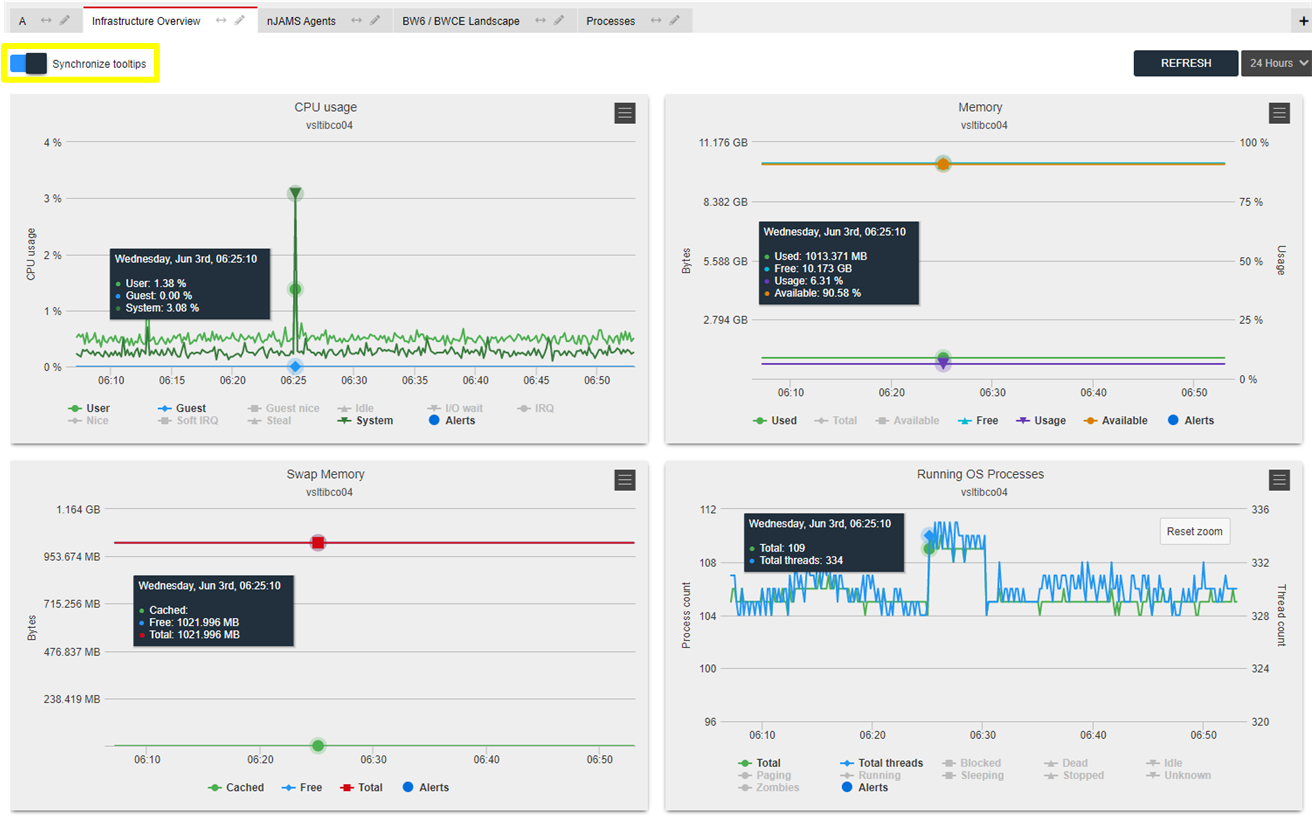
In this example you can see various performance statistics of a Linux machine:
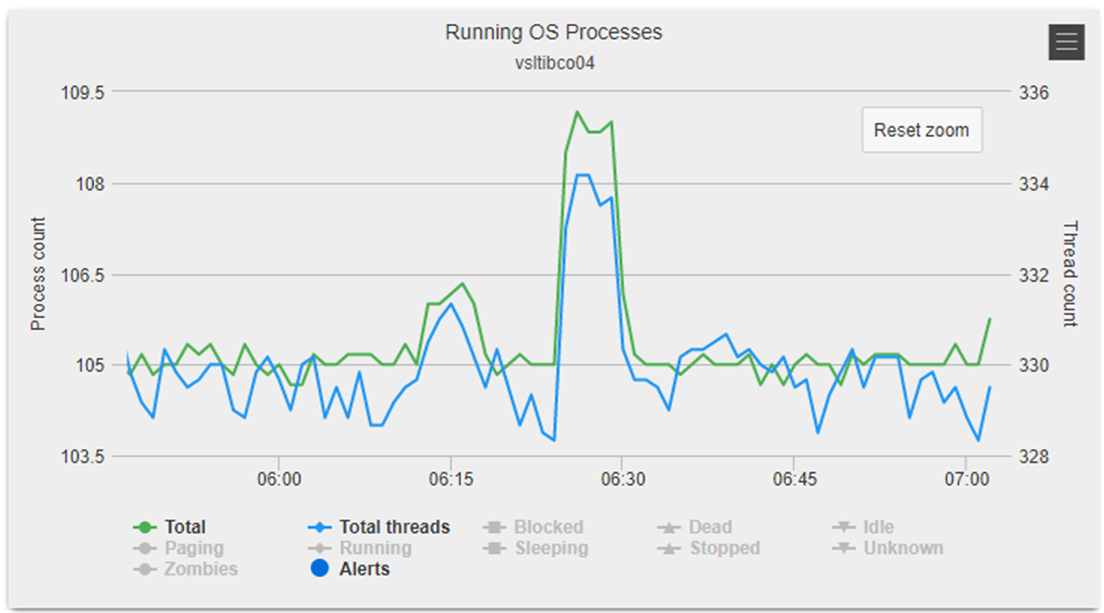
Zoom into a specific section of the chart by clicking and dragging the mouse:
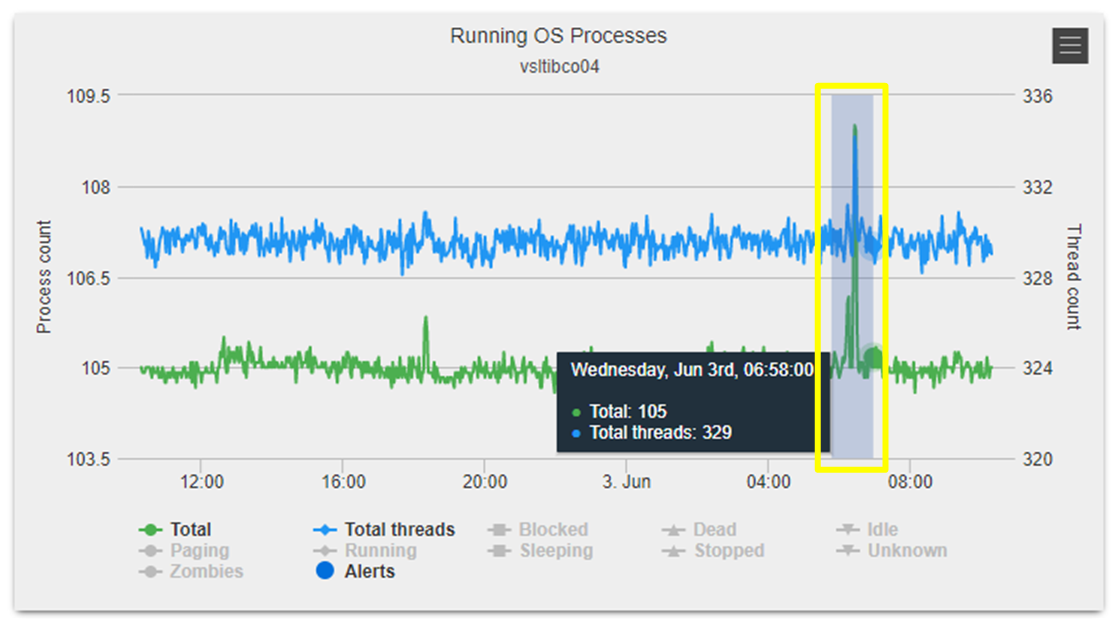
After releasing the mouse button, the chart now represents the selected section:
You can hover over the chart to get a tooltip with more details about this particular time. Activate Sychronize tooltips in order to see more details of all charts about this specific time. For example, this allows you to examine the memory consumption and CPU usage at the same time:
Rules#
Per component you can define rules that trigger actions, if the condition is matched.
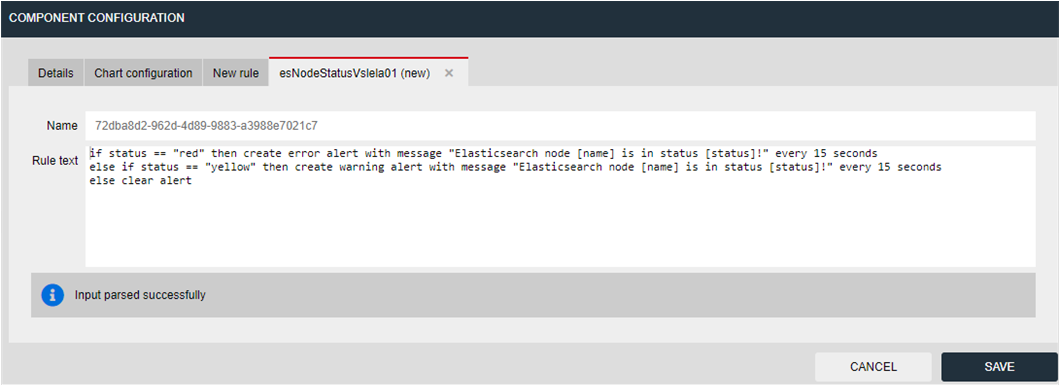
For example, you may want to trigger an alert, if the CPU usage of a machine is higher than 75%. The corresponding rule may look as follows:
if usage_user > 75 then create error alert with message "The CPU usage on host [host] is at [usage_user]%"
The formulation of a rule follows a grammar that is described in the following.
- Rule definition:
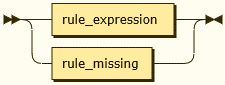
A Rule expression refers to received data from a component.
On Rule missing the rule is triggered, if data is not received from a specific component.
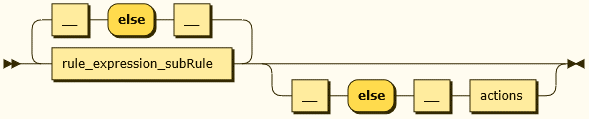
- General structure:
Grammar:

Nested if … then … else:
Example:
if usage_user > 75 then create error alert with message "The CPU usage on host [host] is at [usage_user]%"
else if usage_user > 50 then create warning alert with message "The CPU usage on host [host] is at [usage_user]%"
- Comparators:
Building conditions and chaining them:
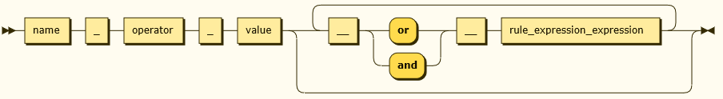
Numeric operators are:
==, =, >=, >, <=, <, !=Textual operators are:
==, =Example:
if usage_user > 50 and host == "vmlinux01" then create warning alert with message "The CPU usage on host [host] is at [usage_user]%"
- Actions:
Simple actions:
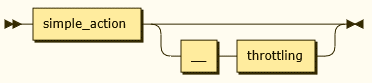
Simple actions:
create alert
set (component) status
execute (a script)
Throttling:
by time
by occurences
Examples:
if usage_user > 50 then create warning alert with message "The CPU usage on host [host] is at [usage_user]%" every 5 minutes
create alert (always clear alerts!):
… then create warning alert with message "A warning message" else clear alert
set compoient status:
… then set status to disconnected
execute a script:
… then execute "/opt/myscript.sh"
chaining actions:
… then execute "/opt/myscript.sh" and then set status to disconnected and then create warning alert with message "A warning message"
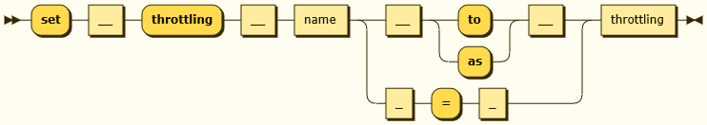
- Throttling:
Simple and complex throttling:
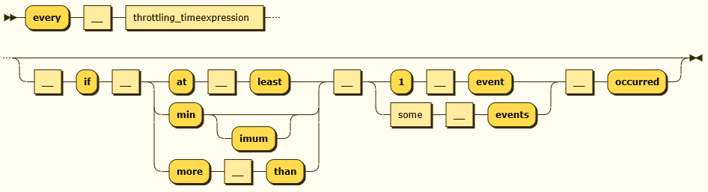
Examples:
execute a script only every 5 minutes:
… then execute "/opt/myscript.sh" every 5 minutes
execute a script only every 5 minutes, if at least 5 events did occur:
… then execute "/opt/myscript.sh" every 5 minutes if at least 5 events occured
- Rule wide setting:
Rule wide variable:
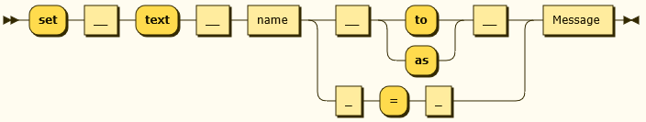
Examples:
if usage_user > 75 then create error alert with message "The CPU usage on host [host] is at [usage_user]%"
else if usage_user > 50 then create warning alert with message "The CPU usage on host [host] is at [usage_user]%"
else if usage_user > 25 then create info alert with message "The CPU usage on host [host] is at [usage_user]%"
else clear alert
set text alert_message to "The CPU usage on host [host] is at [usage_user]%"

if usage_user > 75 then create error alert with message alert_message
else if usage_user > 50 then create warning alert with message alert_message
else if usage_user > 25 then create info alert alert_message
else clear alert
- Rule wide throttling:
Examples:
if usage_user > 75
    then create error alert with message "The CPU usage on host [host] is
    at [usage_user]%" every 5 minutes
else clear alert
set throttling throttle_5 to every 5 minutes
set text alert_message to "The CPU usage on host [host] is at [usage_user]%"

if usage_user > 75
    then create error alert with message alert_message
    using throttling throttle_5
else clear alert