Process diagrams#
The Process Diagram is located at the top right position, next to the Result list. Select tab “Process Diagram”:
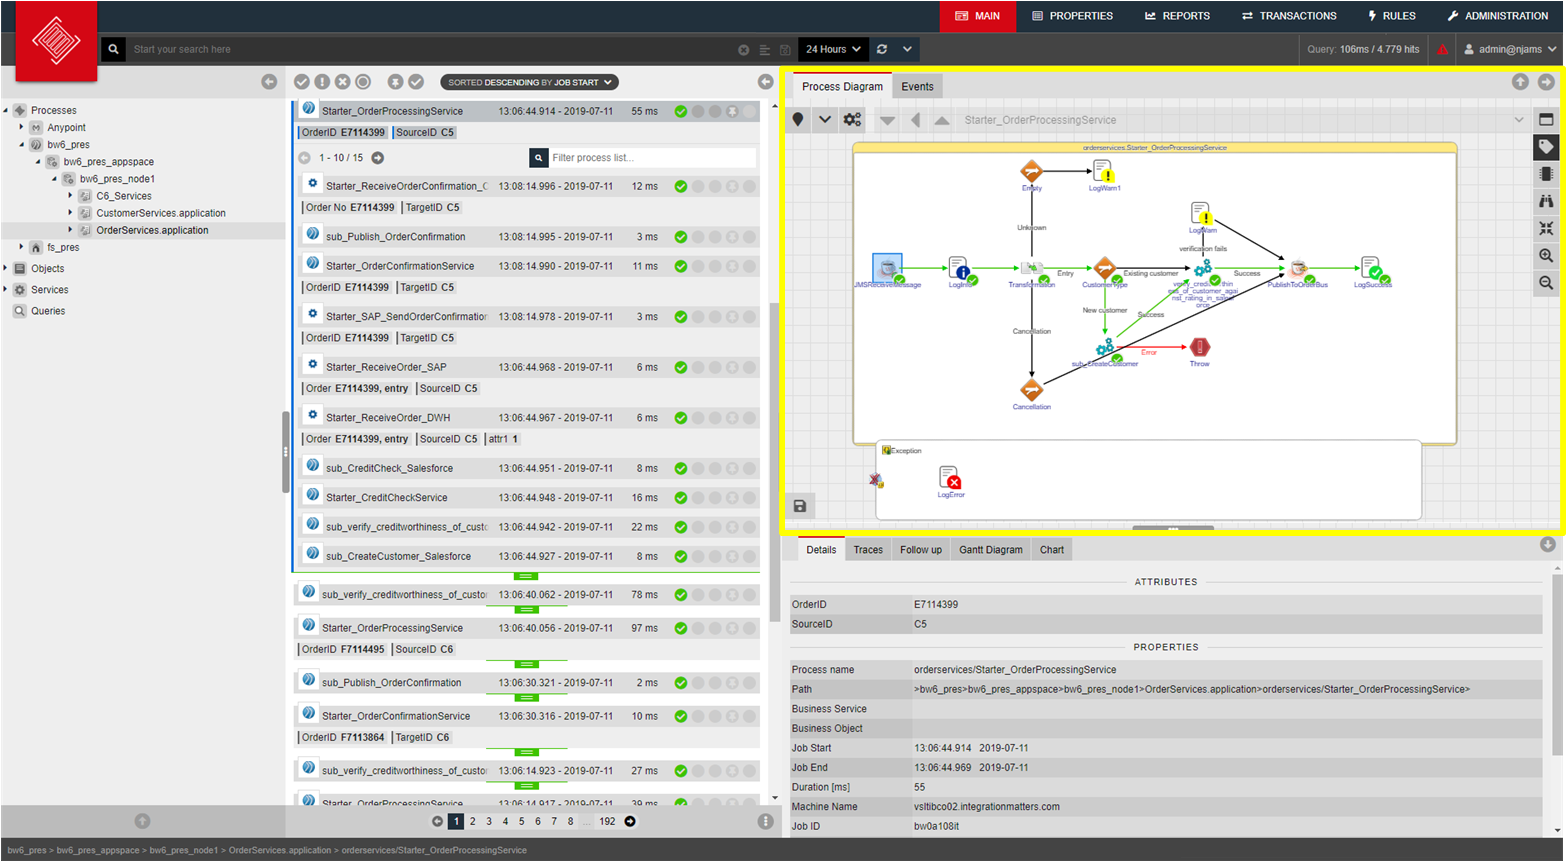
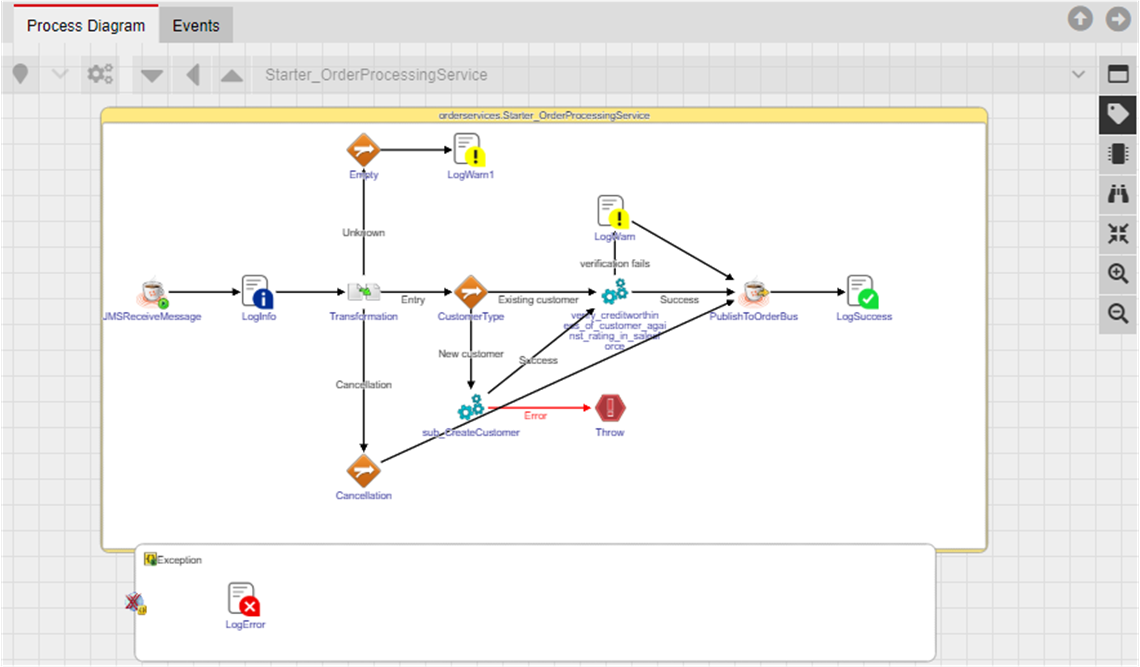
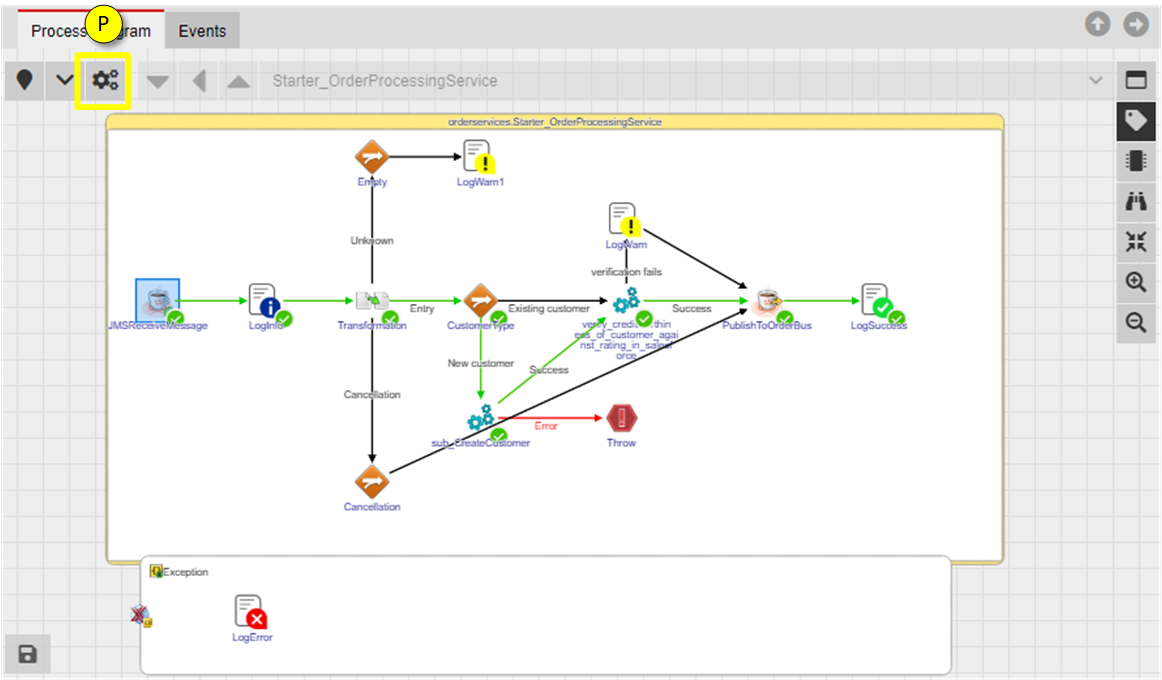
The Process Diagram is the visual representation of the process definition. When a process is selected from Navigation Tree, the most recent process definition is presented:
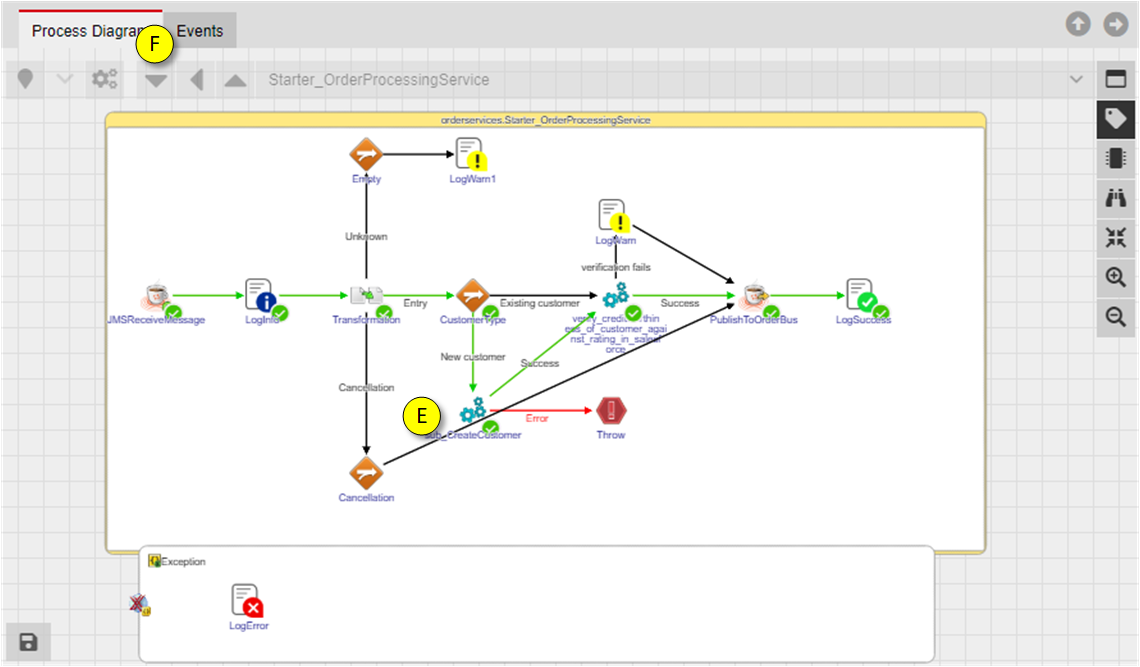
When a process execution is selected from Result list, the corresponding process instance is presented:
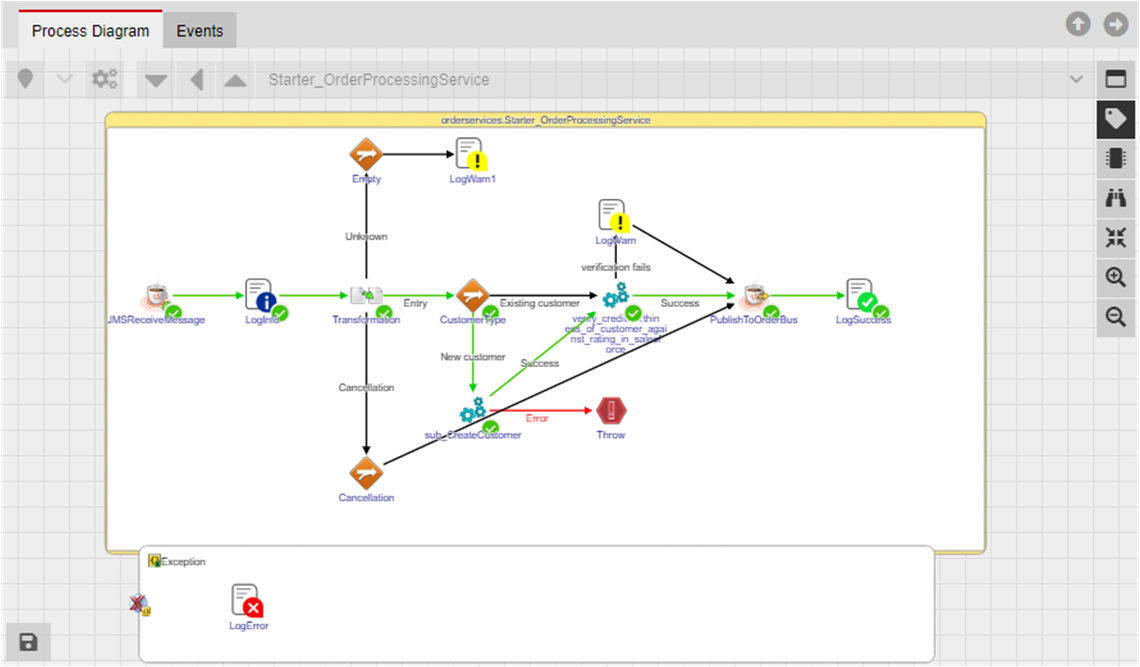
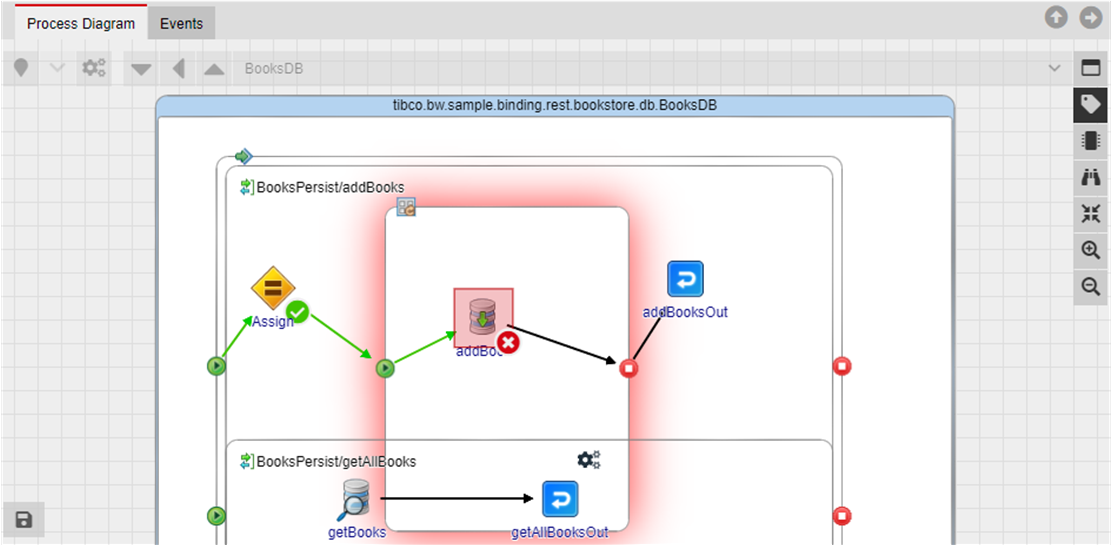
The process intance provides additional information:
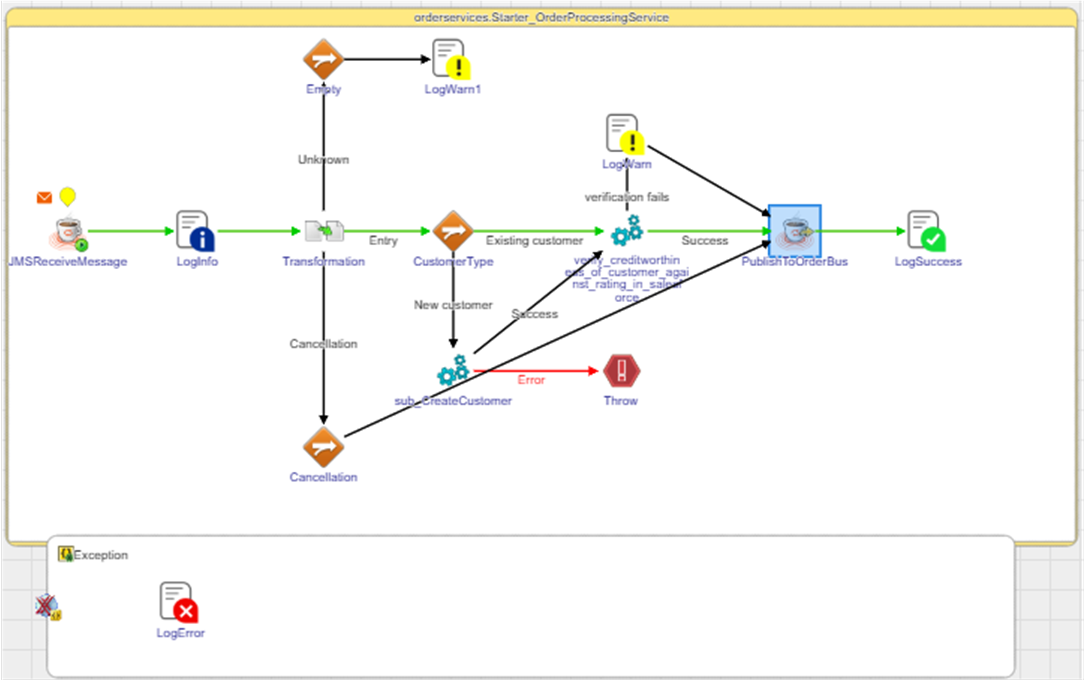
The execution path of the process instance is highlighted by green transitions
The currently executed activity is highlighted
An erroneous activity is highlighted by a red background
Activities with active trace points have a yellow marker (“light bulb”)
Activities with trace data show an orange envelope icon above
Activities that contain an Extract configuration show a configuration icon
- Sizing of Process Diagram:
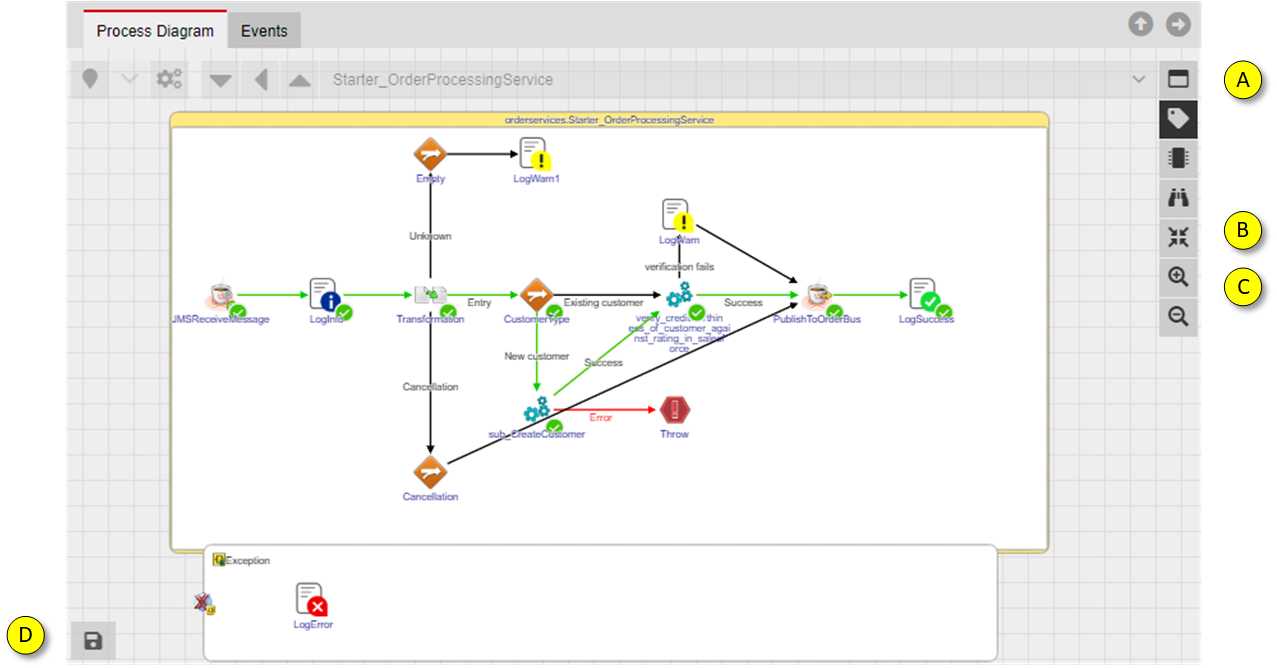
maximize window
fit to window
Zoom in / out
Indicates whether transition information are available
- Navigating within Process Diagram:
A Process Diagram may contain sub processes. You can drill down into a sub process by double-clicking the sub process icon.
If there are many nested sub processes, you can easily navigate between the sub processes layers by suing the navigation buttons.
Select the sub process activity
Click on the drill down button to enter the sub process. Alternatively you can double-click on the sub process activity to drill down.
You can now see the sub process:
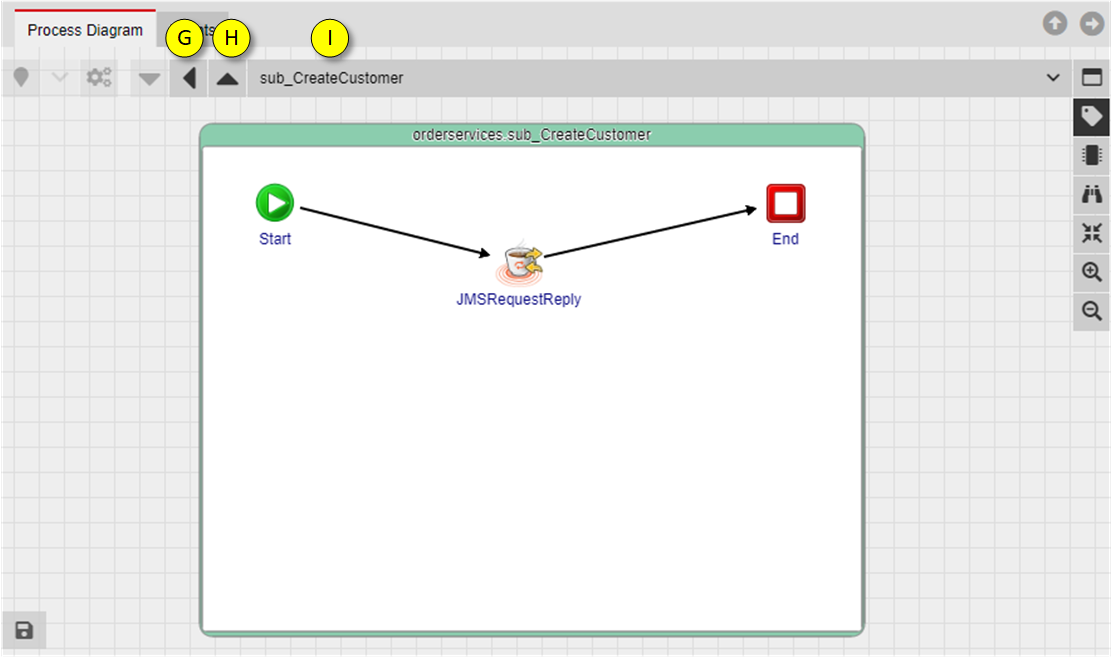
Return to previous process
Return to main process
The combo box provides the stack of the processes. Select a process name from the combo box to navigate directly into a specific process definition.
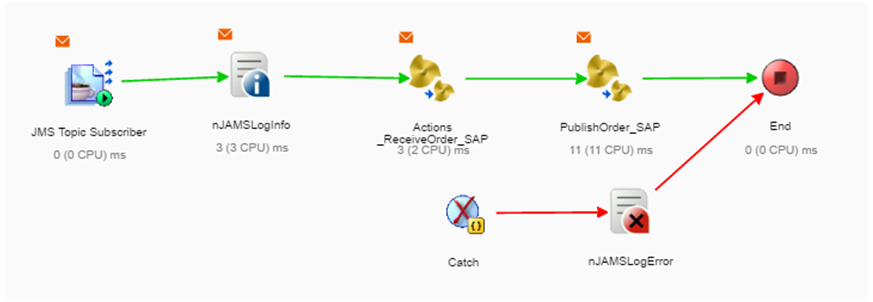
- Show activity timings:
For a process execution you can examine the activity timings:
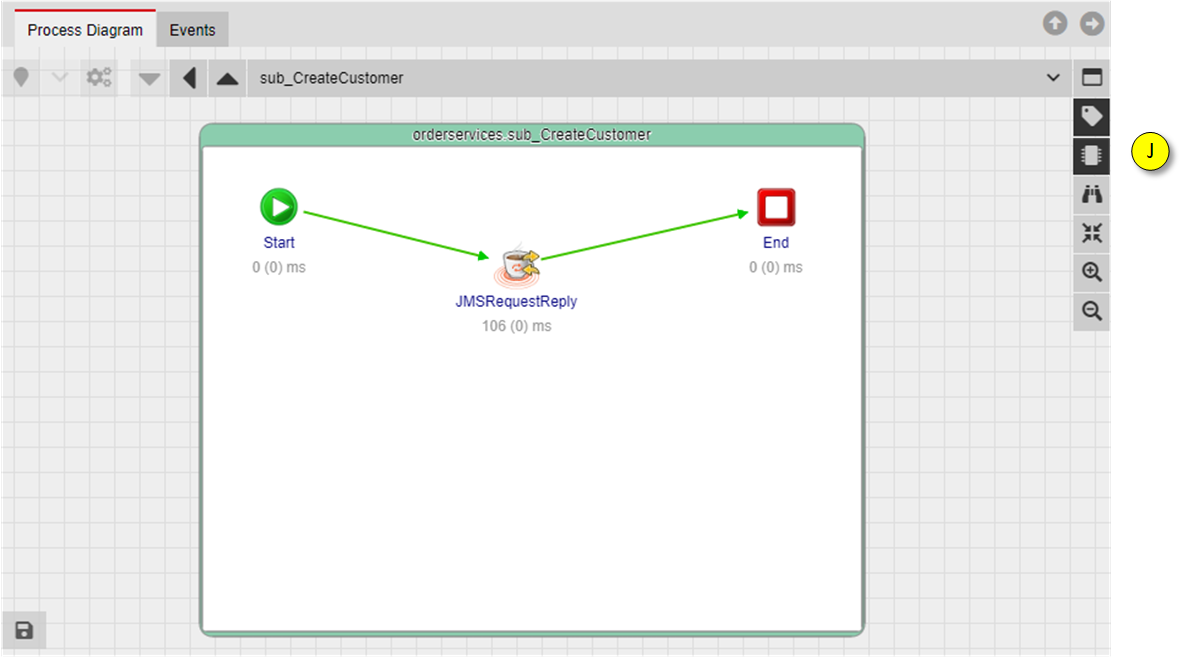
Toggle activity timings on / off
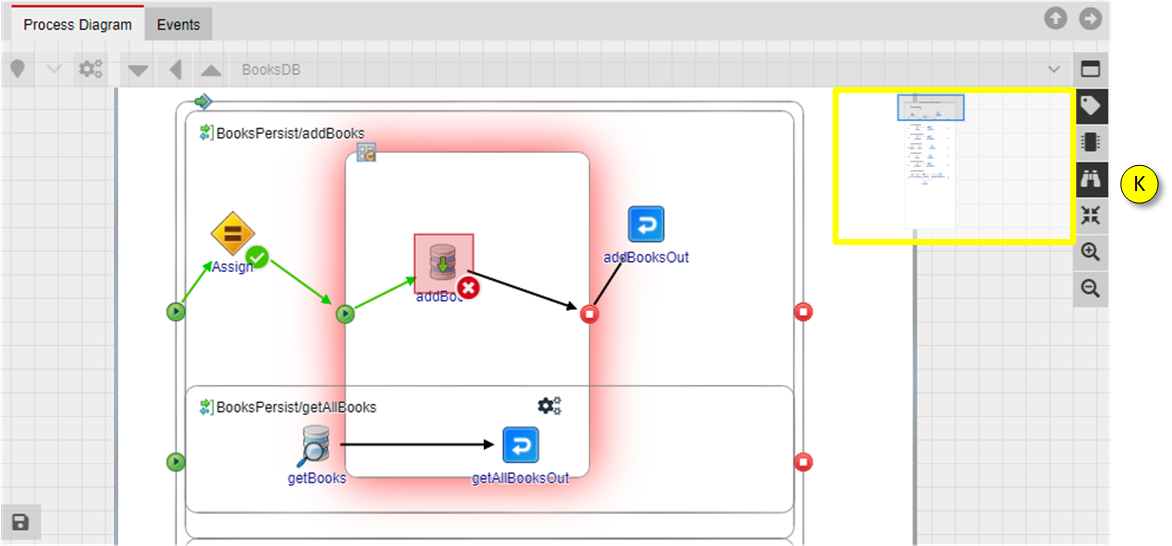
- Show minimap for large process diagrams:
There may be large process diagrams that are reduced in size in order to display them completely:
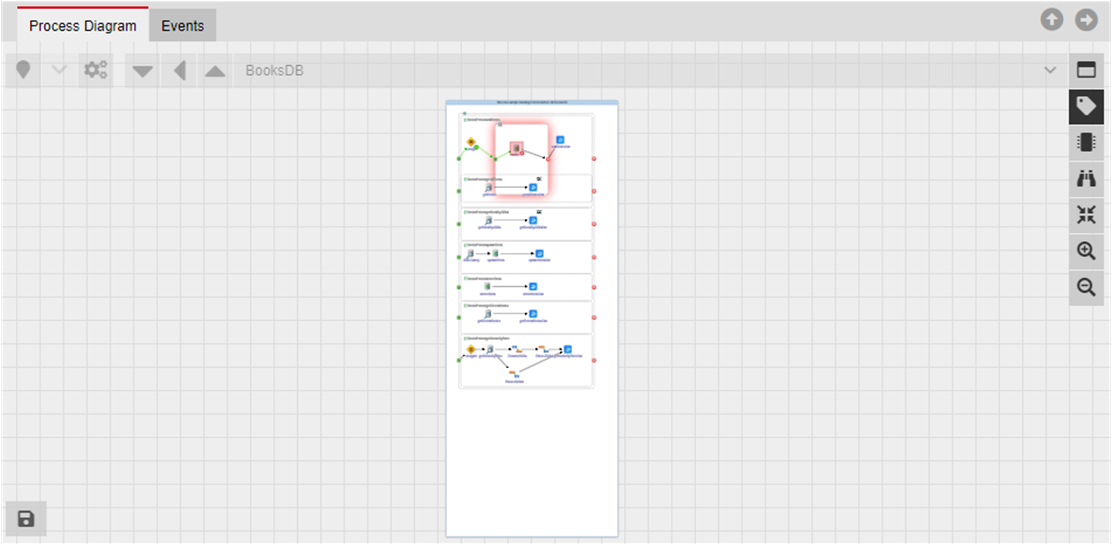
You can zoom in to see the diagram more clearly:
In order to better navigate in a large process diagram, you can use the minimap (K):
- Show executed activities:
This button allows to detect executed activities. You can distinguish, which activites are executed, respectivley not executed.
Basically you can identify executed activities by the transition marked green. If two activites are connected by a transition and the transitions is marked green, it can be assumed both activities are executed.
But there are process diagrams where activities are not connected by trasitions. In this case you can use this button to unveil executed activities. An executed activity is flagged accordingly.
Toggle to unveil executed activities on / off.
- Trace points:
For each activity of a process definition you can enable Tracing. Tracing collects more details of an activity during process execution.
Tracing is enabled either for a limited period of time or for a limited number of process executions.
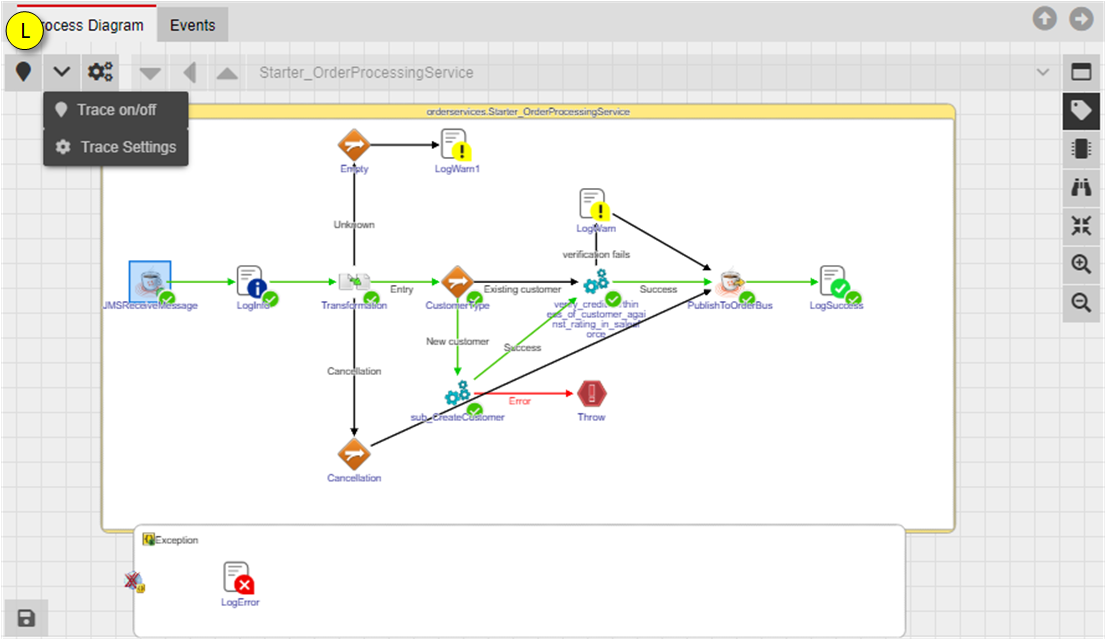
Select an activity and click on the “light bulb” to enable/disable Tracing. From the combo box you can select “Trace Settings” to configure the Trace Point.
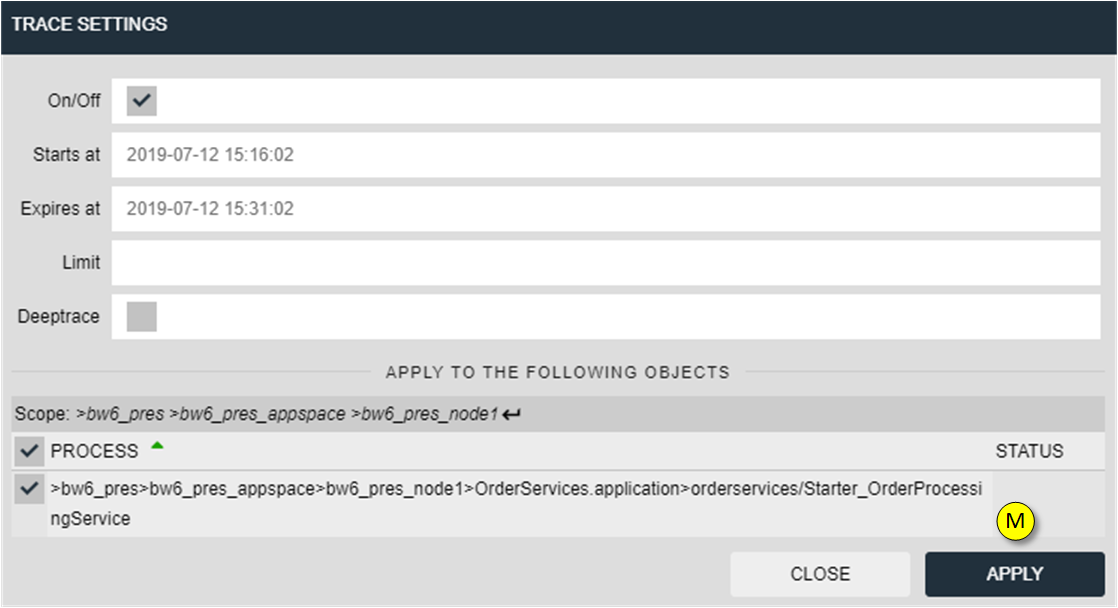
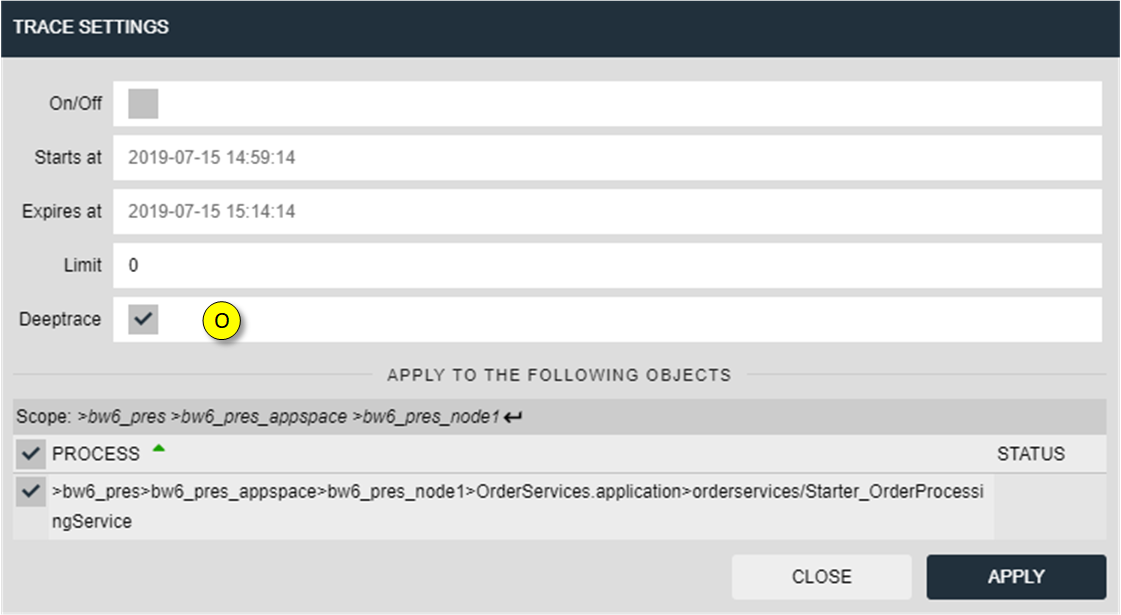
Click on APPLY to send the Trace Point configuration to the designated nJAMS Client. The following options are available:
On/Off
Enables / disables Tracing for a particular activity
Starts at
Set Start Time of Trace Point
Expires at
Set End Time of Trace Point
Limit
Enter a number of maximum invocations. If the limit is reached, tracing will be disabled. If the limit = 0, tracing will be disabled after the expiration time has been reached.
Deeptrace
Enable Deep Trace
Apply to the following Objects
Select related engines to which you may apply these settings to. Related engines represent Fault-Tolerant or Load-Balanced engines. You can specify the scope where nJAMS will look for related engines. By default the scope is specified for the current Deployment. In this example there is one related engine to which you may apply these trace settings to.
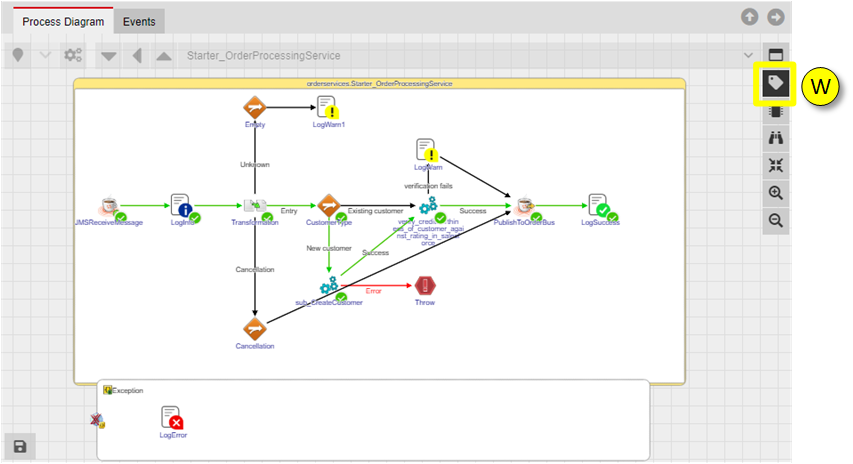
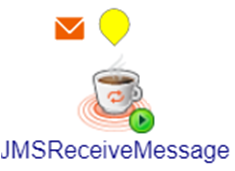
When Tracing is enabled, the activity gets a light bulb icon to indicate active Tracing:

An orange envelope icon indicates available trace data:
- Enable Deep Trace:
Deep Tracing allows you to enable Trace Points on all activities on all subsequent processes. For example, a service consists of three decoupled processes A, B, and C: Process A calls process B, process B calls C. By using Deep Tracing you can enable tracing on all activities of the called processes B and C in one step.
Usage:
Select a JMS Publisher activity in process A as starting point for Deep Tracing:
Click on “Trace Settings”
Select “Deep Trace” (O):
Click on “APPLY”
Enabled Deep Tracing is represented by a (+) symbol:
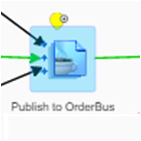
From now on all activities of the subsequent processes called by JMS will collect trace data:
Note
Deep Tracing is only available for JMS and HTTP activities. In addition, the nJAMS Client must be capable to support Deep Tracing.
- Extracts:
Extracts allows you to instrument process activities non-intrusively. Extracts could be an alternative for using nJAMS log activities, especially if you want to enrich log messages on the fly with functional information, which can be searched for later in nJAMS GUI.
Note
Managing Extracts requires WRITE privilege on the specific process definition.
To manage Extracts open the “Extracts configuration” dialog by clicking on the Extracts icon (P):
The dialog opens for editing the Extract’s definition:
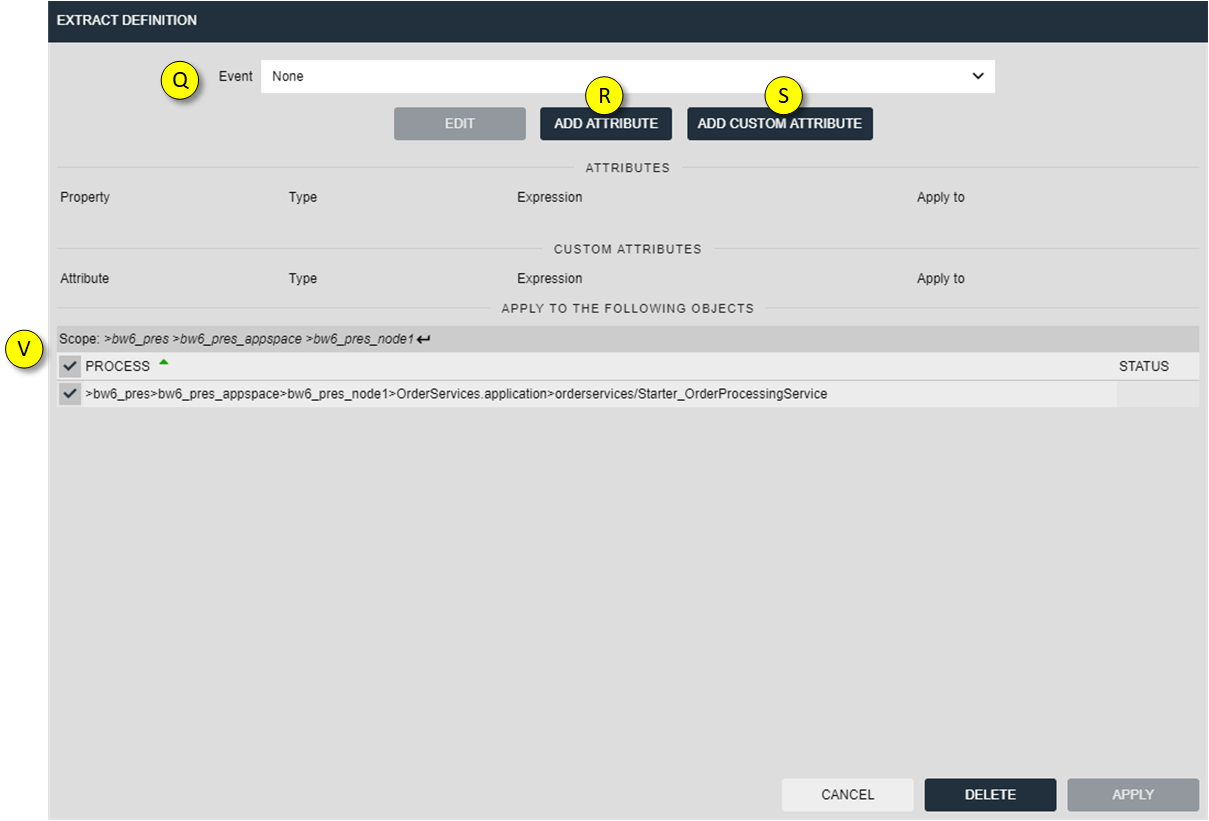
Select whether an Event is to be generated, when the Extract is executed.
ADD ATTRIBUTE allows defining regular expressions or xpath instructions to extract data from the activity’s input or output data and assign the result to the designated Attribute: Business Service, Business Object, Correlation ID, External ID and Parent ID, Event Message, Event Code, Payload, and Stacktrace.
ADD CUSTOM ATTRIBUTE allows defining individual custom attributes of your choice.
Select the related scope to which you may apply these Extract definitions. You can apply the Extract to multiple targets.
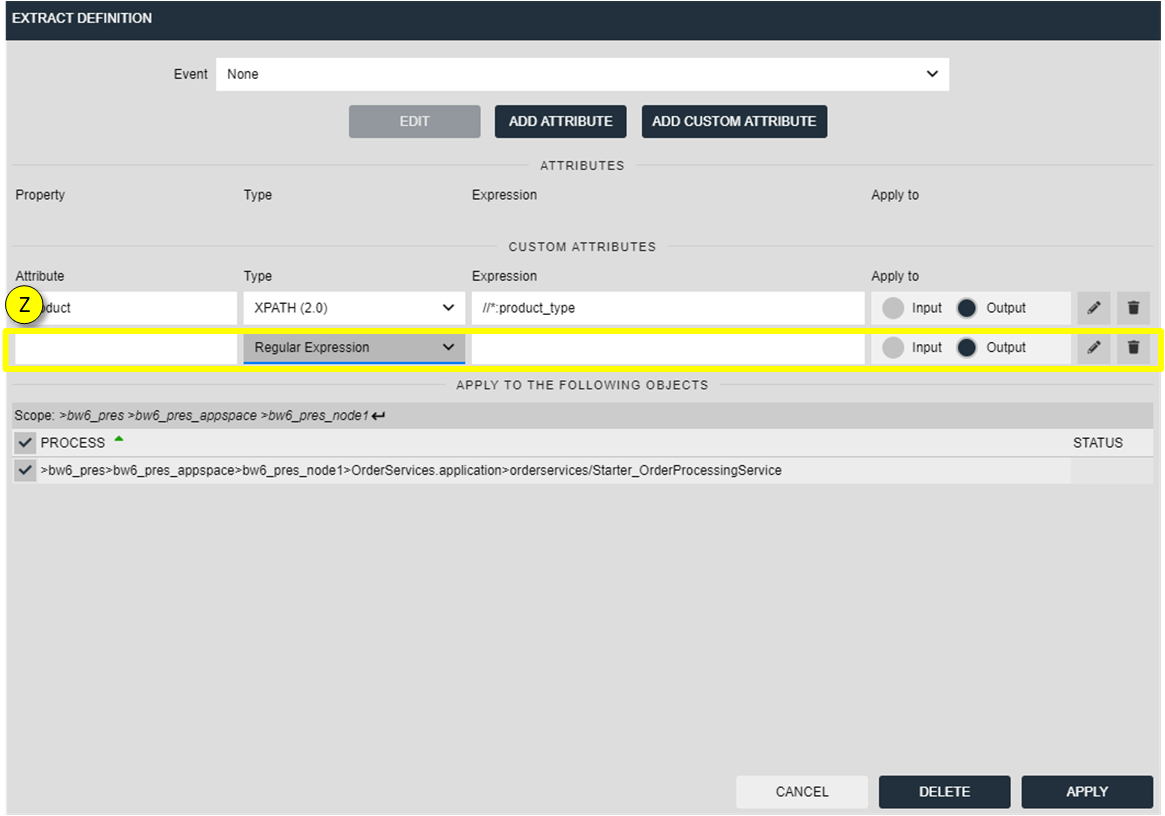
For example, click on ADD CUSTOM ATTRIBUTE and the following dialog opens:
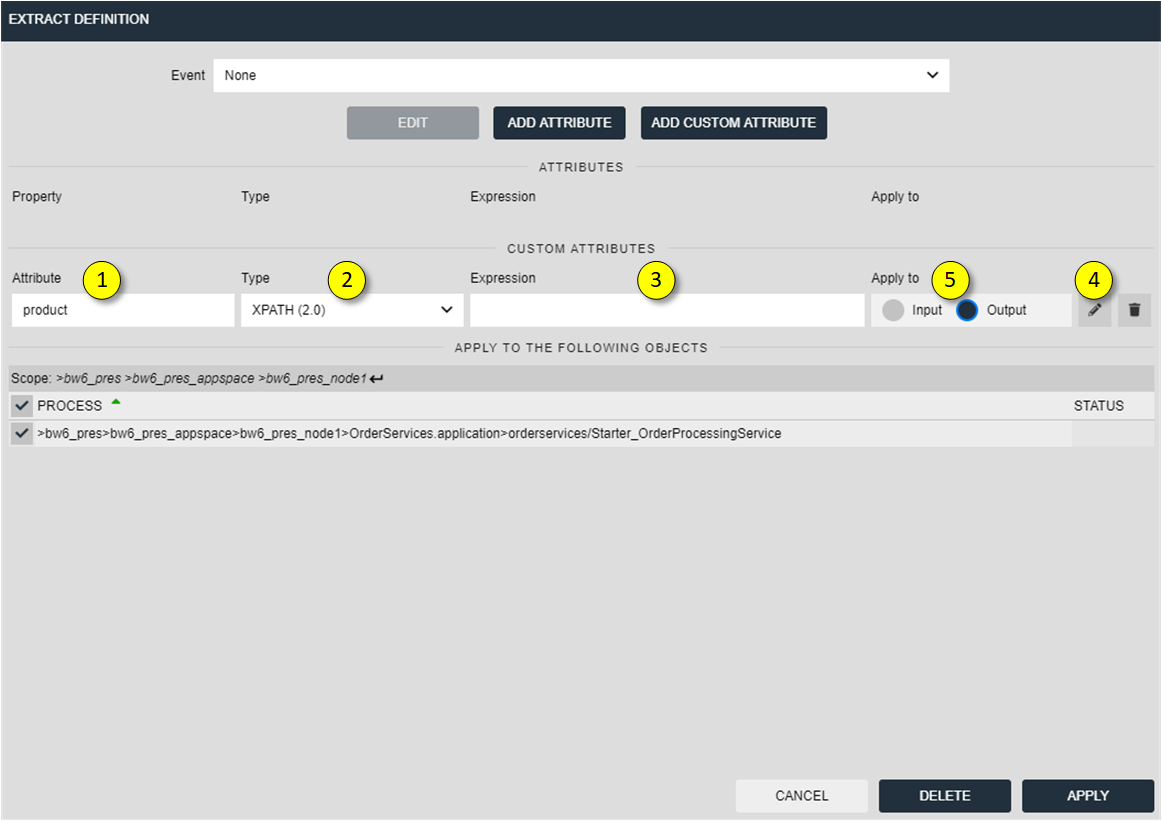
Enter the name of the new custom attribute
Select a type of expression, either Regular Expression, XPATH 2.0, or JMESPATH.
Enter the expression
Click on “Edit” to open the expression dialog
Specify input or output structure of the expression
The “Edit” dialog allows you to test your expression based on previously collected trace data:
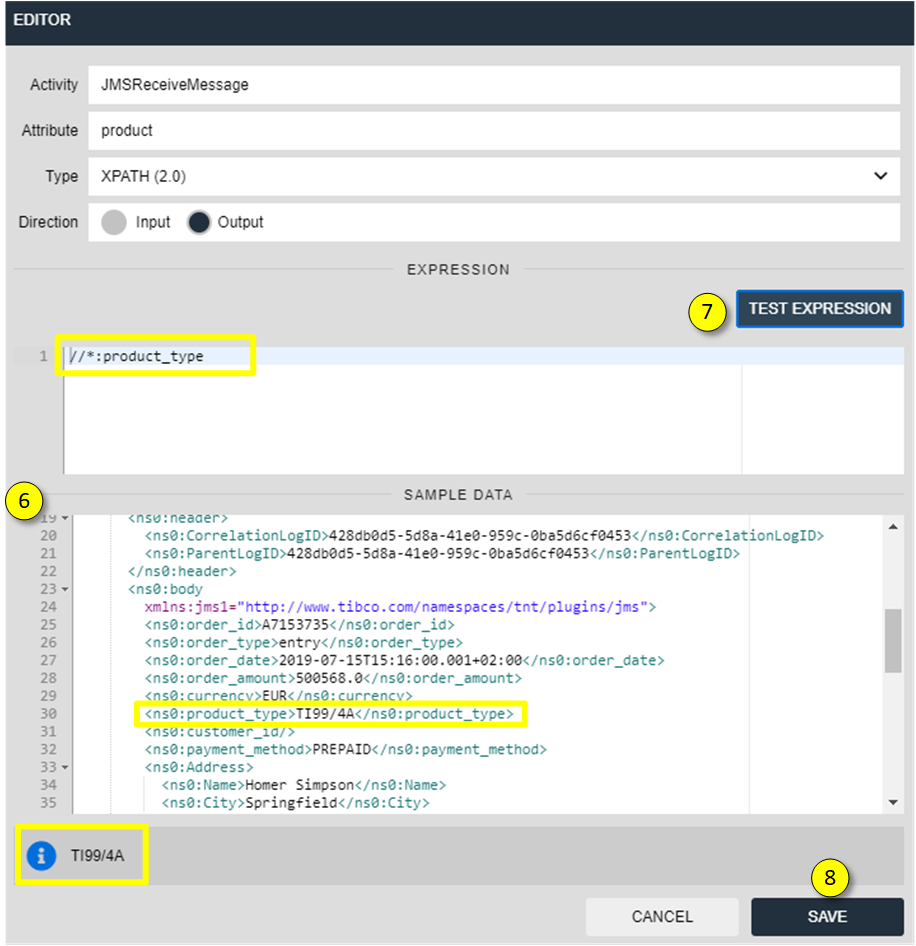
If the activity contains trace data, you can see the trace data for input and ouput and test your expression against this sample data.
Press TEST EXPRESSION and the result of the expression will be provided below.
Click on SAVE to store the current expression
When the Extract definition is complete, you have to apply the Extract to nJAMS Client:
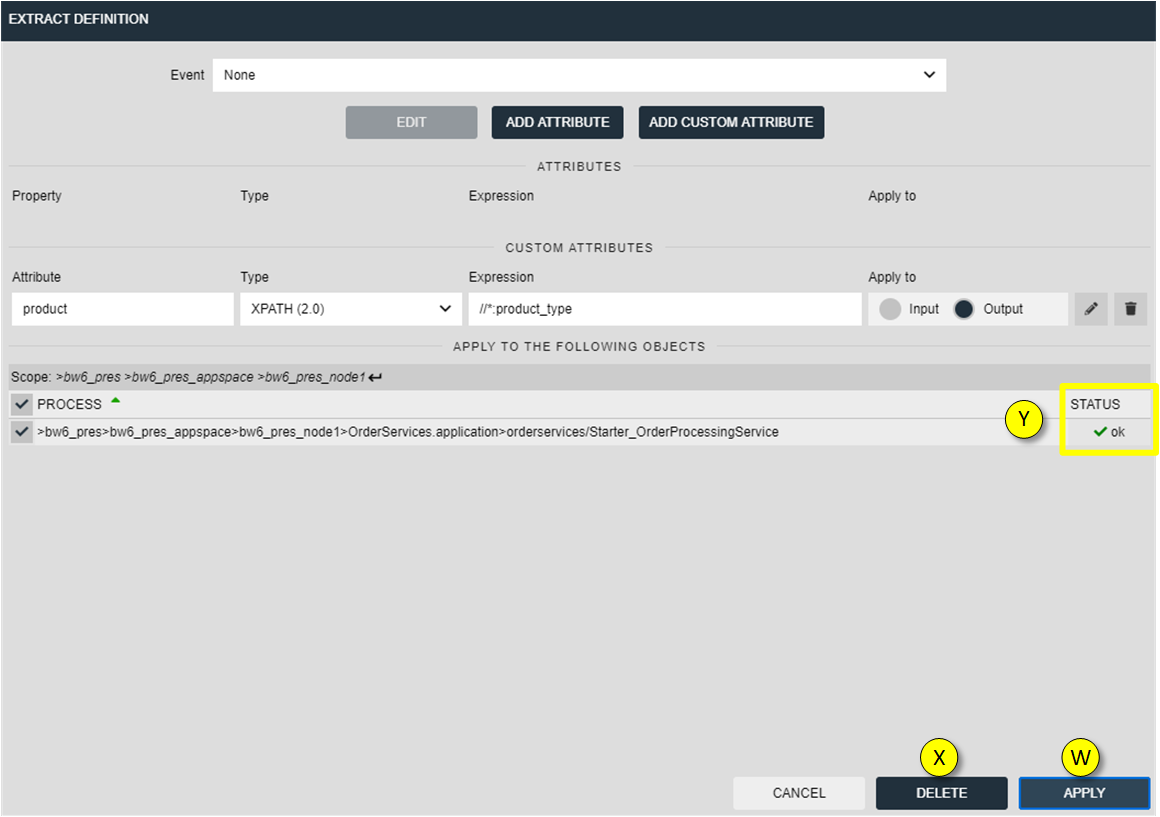
APPLY applies the configuration to nJAMS Client
Click on DELETE for removing an Extract
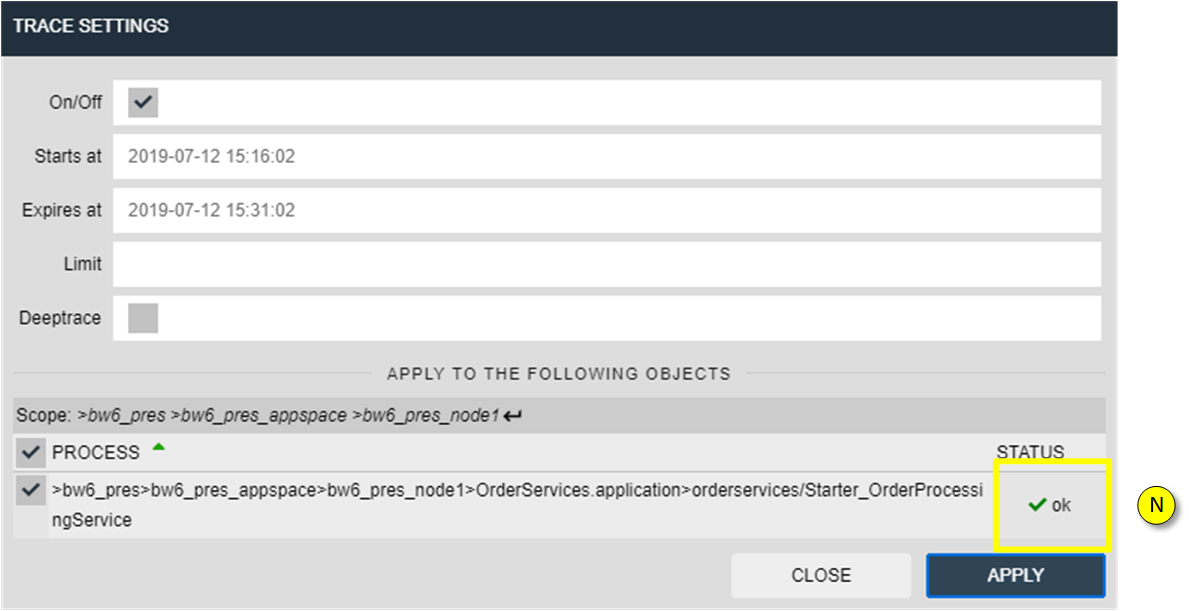
The status indicates whether applying the Extract was successful.
When an Extract is defined for an activity, the Extract icon is present at the corresponding activity:
- Versions of Extracts:
Extracts are versioned. That means, the current aspect configuration for a process definition can be inspected by first selecting the process definition from the Navigation Tree. Historic settings are available, when a process entry is selected in the Result list. The Extract configuration shown in the latter case matches the configuration that was active when the process was executed.
- Conditional Extracts:
Extracts can also be based on conditions. You can define a rule that will only create an Event, when the condition is true.
Usage
In combo box Event select Rule.
Specify the type of expression. You can choose Regular Expression or XPath 2.0.
Enter the expression depending on its type
Choose whether your expression refers to incoming or outgoing data of the activity
Example:
Suppose there are incoming order data that contains different product types. in case the order type is “TI99/4A” an event should be generated.
The sample incoming data is:
At “Event” select Rule
At “Type of expression” select XPATH 2.0
The expression is:
//*:product_type="TI99/4A"Click on APPLY. When the process is executed the next time, a new event of type INFO is generated.
Moreover, assume we want to send an event of type SUCCESS if the order type is TI99/4A. For all other order types we want to receive a WARNING. The expression is:
if (//order_type="TI99/4A") then "SUCCESS" else "WARNING"In summary you can see that Extracts can be used to implement pretty complex scenarios.